The last 3 to 4 months, we’ve highlighted the energy (XLE) and natural gas (UNG) trends as the best buy-the-dip opportunities in the market. And, for the last 3 to 4 months, that game plan has served us incredibly well.
However, it’s looking like those bullish trends stop here (for now).
We work our “buy-the-dip game plan” when (and only when) our bullish signals are present.
As of Monday, the energy and natural gas charts stopped printing our bullish signals. This was our first heads up that things might begin to break down.
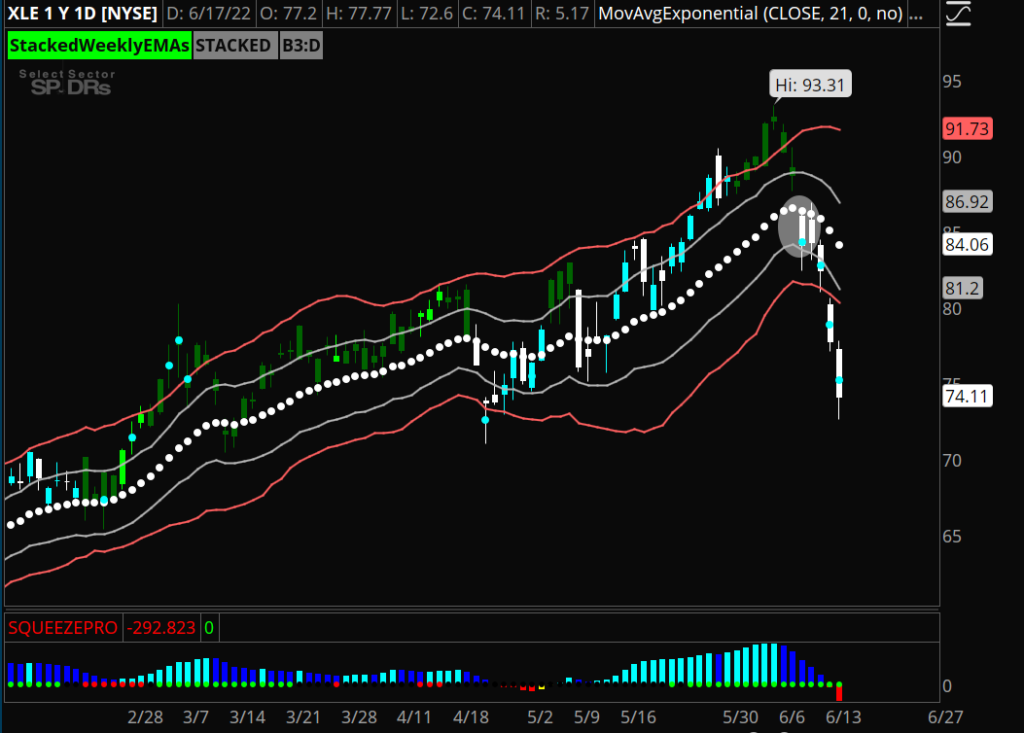
Our buy signals are based on our bullish trend, structure, and momentum criteria. The signal gets printed (green bars) when at least 6 out of our 7 criteria are met. In order to get the daily buy signal, the weekly chart must also meet our criteria.
So long as we have the buy signal, we look to get long. As soon as the signal is cancelled, it’s time to get cautious.
Since losing our daily buy signals, here’s how much the recent leaders have fallen over the last 3 to 4 days:
- XLE: -14%
- OXY: -9%
- VLO: -18%
- MPC: -17%
See how quickly things can change?
This is why as traders, we need to know when to move on to new trends and setups. Far too often, traders don’t know when it’s time to stop buying the dip. This can result to giving back all the profits made when the trend was actually in tact. That’s a big “no-no”, and giving back profits like that should be avoided like the plague.
We thank these trends for their service over the last few months, but for now we’ll be avoiding getting long energy and natural gas until our signals show up again.
In Sunday’s video, we’ll dive deeper and look at these signals across the markets.
Stay Focused!