Heading into July, the question on all traders’ minds is whether or not the markets continue to roll over from here.
We expect more downside, but is there potential for a “bear market rally” before the next big puke?
For the markets to have any chance of rallying in a sustainable fashion in July, a few things will have to come together. Add these to your notes, and watch them closely over the next few weeks.
SPY Weekly Chart:
There are a few important observations to make about the weekly chart of the S&P 500 (SPY).
For starters, we must respect that the weekly squeeze is firing to the downside. The rule-of-thumb is that once a squeeze fires on any time frame, we’re typically looking for 8 to 10+ bars of momentum in that direction. Given that this is a weekly squeeze firing short, this signal could have enough gas in the tank for another 4 to 6 weeks of steady downside.
While this squeeze will likely take us lower (eventually), we must also recognize that the weekly chart is technically oversold, trading at the -2 average true range (ATR) extension. More often than not, once the market drops to -2 ATR under the weekly 21 exponential moving average (EMA), there is a growing probability of the market reverting to the mean (rallying to the weekly 21 EMA).
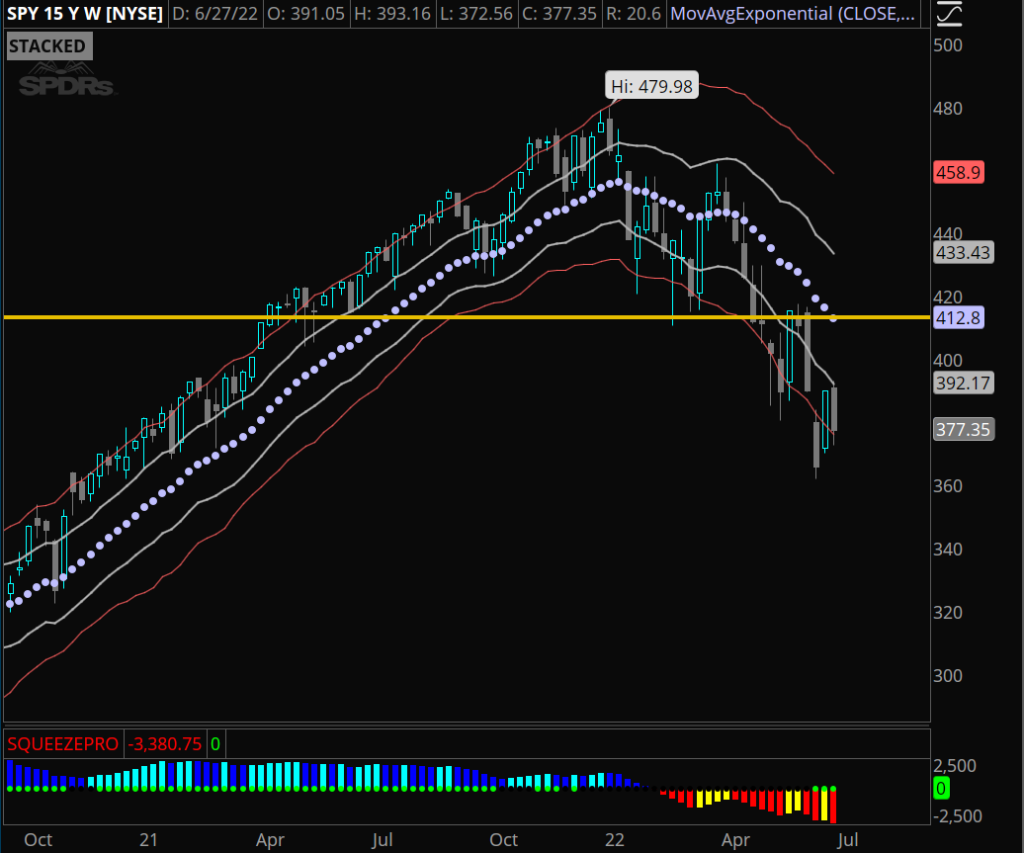
We have a squeeze that could take us much lower, yet the market is a bit oversold. What can we watch from here for confirmation of the next move?
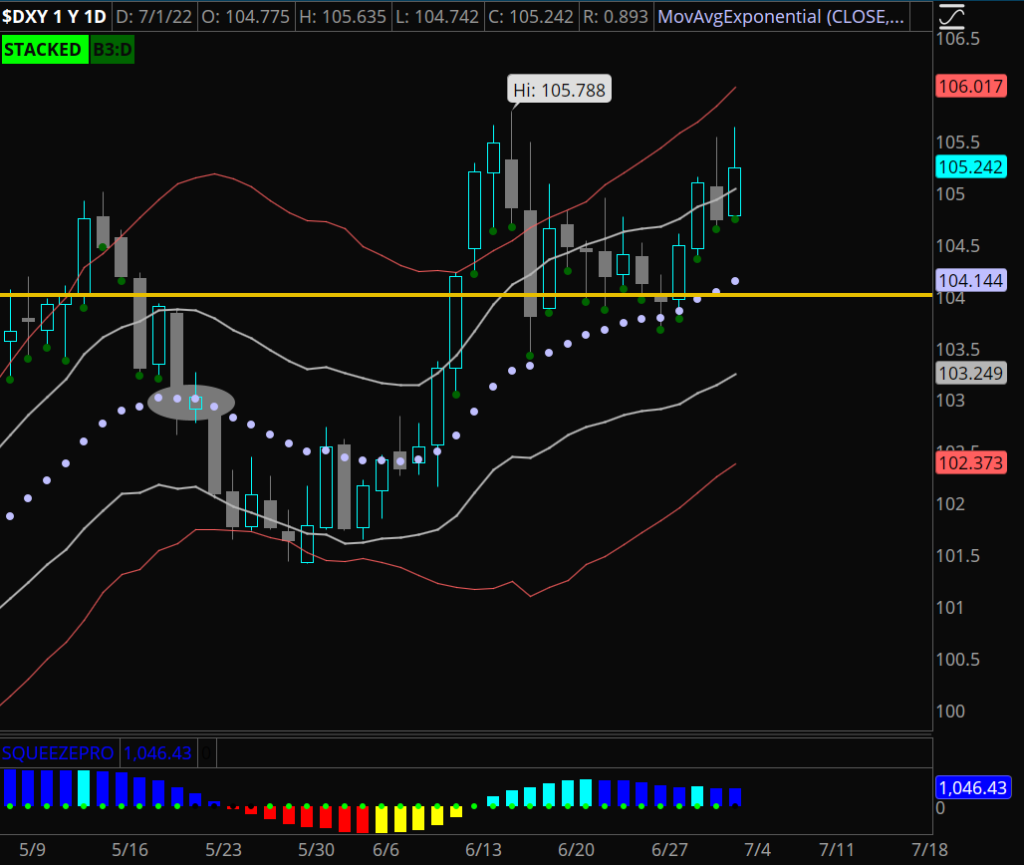
DXY: US Dollar
To keep things simple, the markets tend to trade lower if the dollar trades higher.
The DXY chart looks incredibly bullish with our Big 3 buy signals across multiple timeframes. The structure and signals suggest this wants to trade higher (for now). If it does, we can expect the markets to grind lower. For the market to have a good chance of a real rally, we’ll need to see DXY under $104, which should cancel out the current buy signals.
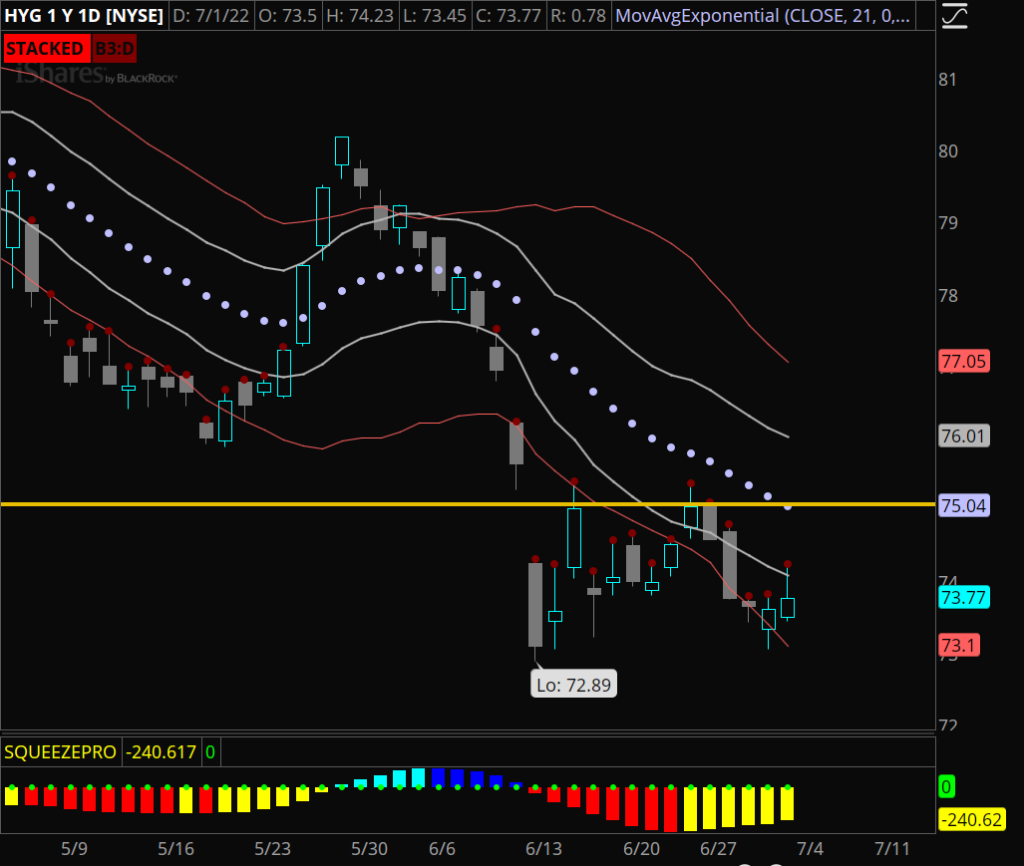
HYG: “Junk Bonds”
So long as HYG trades lower, we can expect the bears to remain in control of the market.
At the moment, we have multiple timeframes printing our Big 3 sell signal on HYG. This suggests HYG wants to move into lower prices. For a bear market rally in the SPY and QQQ to unfold, we’ll need to see HYG trading above its daily 21 EMA around $75+.
These are simple yet important things to keep a very close eye on as July unfolds.
For now, our game plan is to take whatever the market has to offer, long or short, with a focus on our Big 3 signals. In this weekend’s video, we’ll take a look at HYG + DXY and a few other setups through the lens of the Big 3 indicator.
We are excited to announce that all members of the Compounding Growth Mastery are granted early access to purchase the Big 3 Buy and Sell signals. We look forward to using the Big 3 indicators in our next live trading session together.
Enjoy your long weekend, be safe, and it’s back to work next week!
Stay Focused!