Let’s break down how I use my two favorite internals to better understand what moves the market.
We’ll combine how to understand $ADD and $TICK with the overall market to get a better sense, gauge, and feel when you are trading the major indexes. Understanding market internals can be especially helpful in identifying trends and choosing more precise entries and exits.
You must include the dollar sign ($) before the ticker name when entering the tickers into your trading platform.
$ADD: Advanced Decline Line
$ADD shows whether most stocks are trading or advancing above (or below) their prior close. This gives us a sense of what the overall market is doing.
Here’s how one reads $ADD on a chart:
- Above zero (positive): Most stocks are up for the day, green day
- Below zero (negative): Most stocks are moving lower for the day, red day
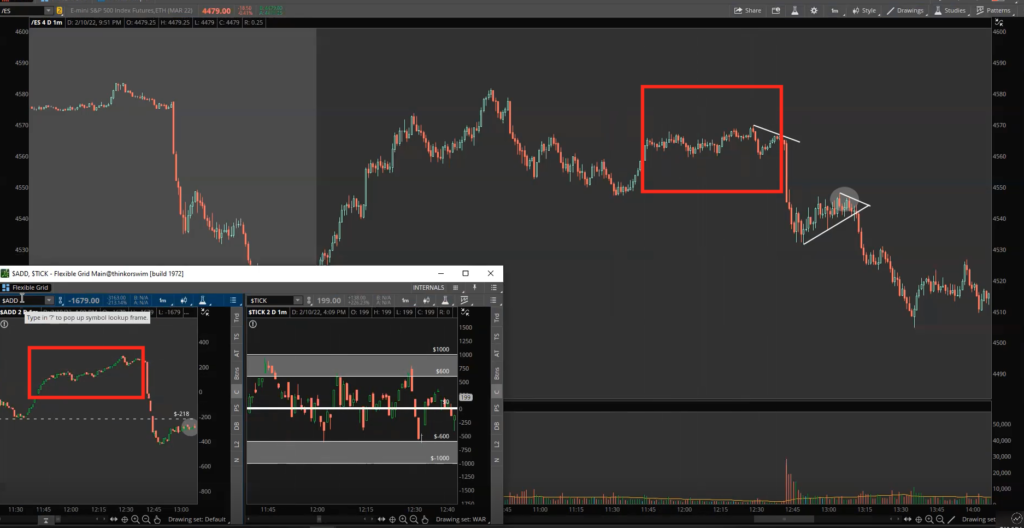
In the image above, when $ADD was steadily trading sideways above zero (in the bottom left-hand corner), the S&P 500 (/ES) was also chopping to the side with a slightly green day.
When thinking about $ADD, we like to think of it as the steering wheel of a car pointing us in specific directions.
$TICK:
$TICK shows how fast things are getting bought and sold. Consider $TICK as the gas pedal for our car metaphor, representing how quickly price is moving.
There are certain levels and zones that we like to focus on for $TICK:
- Zero: When the market is chopping sideways
- Upper zones: $600 to $1000
- Lower zones: -$600 to -$1000
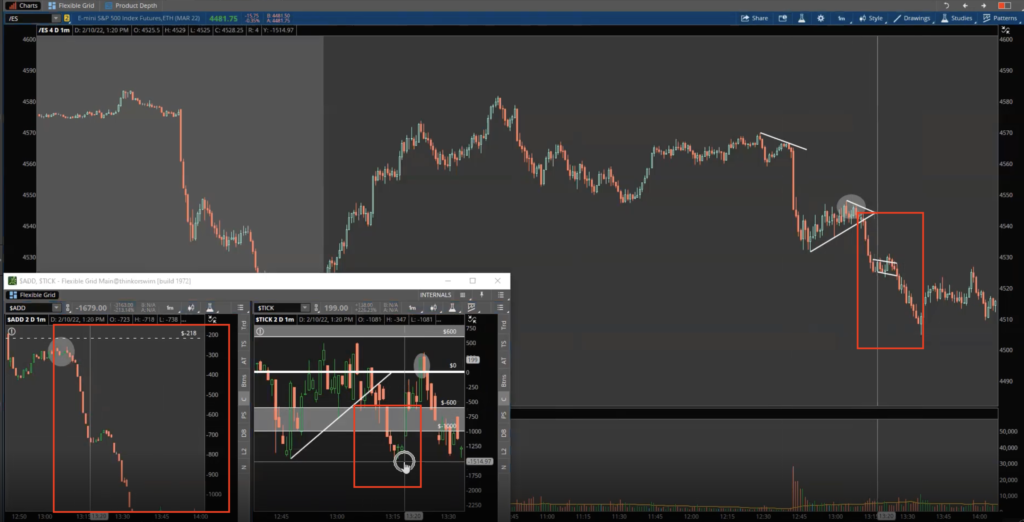
When $TICK starts to reach the upper threshold from $600 to $1000, this indicates extreme popping or buying. If $TICK stays in this upper range, price will likely explode. Think of this as pushing on the throttle and sending the car forward (or, in this case, pushing price higher).
On the flip side, when $TICK hits the lower zone, extreme selling is happening. We can think of this as pushing on the car brakes.
When we put the two internals together, we can ultimately get a confirmation of the move ($ADD) and then see how fast the move will unfold ($TICK).
Case Study: 2/10/2022
In the video below, we’ll walk through both $ADD and $TICK. We’ll go through what I look for and how I use the internals to gauge the overall market using an example from Thursday, February 10, 2022.
We hope you’ve enjoyed this introduction to using $ADD and $TICK to get a better edge in trading. Understanding how to use these internals can be especially useful in defining trends in the market and understanding when exactly to enter and exit your trading positions.
Especially in volatile conditions, we can use these tools to better understand what’s happening in the market and take advantage of big moves.
Stay Focused!