
Energy is the one group that has held up while everything else softened, and it’s the place where I’ve put new money to work this month. On Tuesday I opened an October at the money call on $XOM in the Compounding Growth Rooms. Two sessions later the Fed came and went, the broader tape rolled over, and I have not touched the position. Let’s take a deeper look at the XOM squeeze trade: why I own it, what has to keep working, and the one thing that takes me out.
Why I Took The XOM Squeeze Trade In The Top Ranked Sector
XOM, 4HR Chart 09.17.26
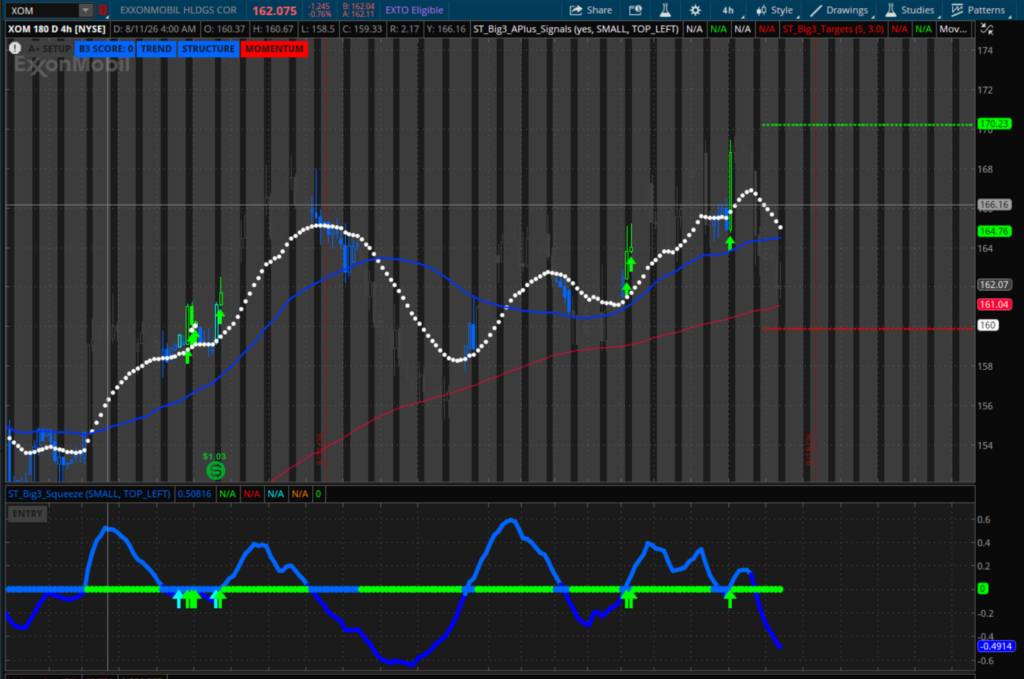
This is the setup I was stalking, with the 21 EMA (dotted white) and the 50 SMA (solid blue) marked, and the A+ entry being shown on the chart.
The construction here is simple. $XOM printed an A+ Big 3 Squeeze setup, and $XLE was ranked the number one sector at the time I entered. That is the whole thesis: take the best setup inside the group that is actually being bought.
When I posted the trade Tuesday, $XLE was running at 98% of its best ranking, big tech was sitting at 8, and semiconductors were at negative 42. Those three numbers are the entire case for being in energy instead of tech.
I also posted it with an instruction attached: size this small enough to accept the max loss based on the current market ranking. When the overall market score is neutral, the setup can be A+ and the position still has to be small.
Energy Has Already Failed Once This Month
XLE, Daily Chart 09.17.26
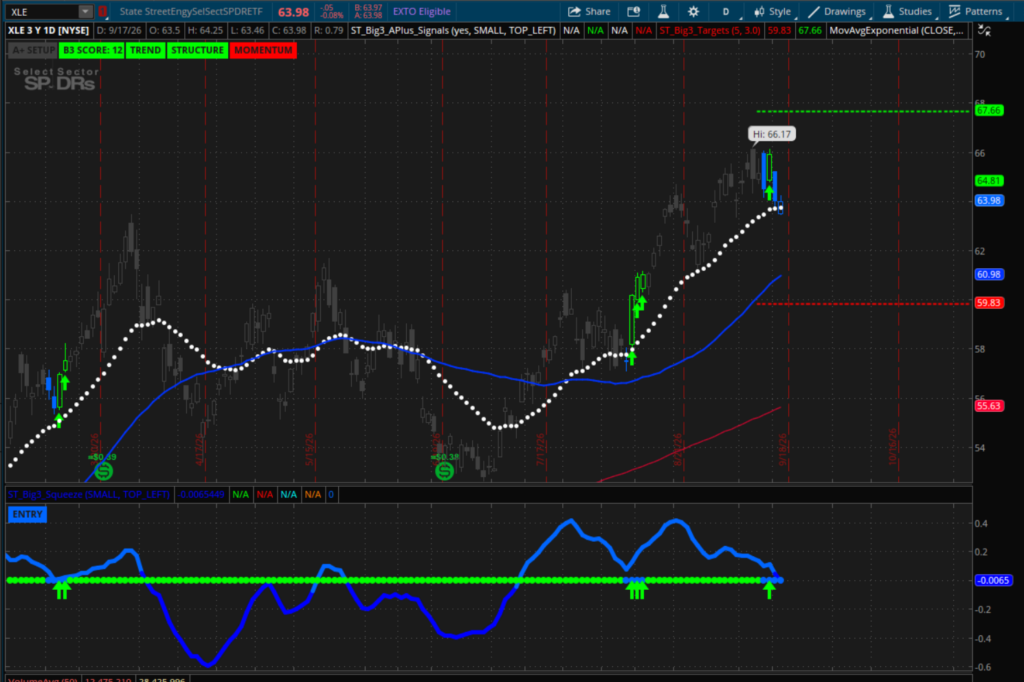
The sector ranking is what earned $XOM the entry. This is the group I need to keep leading for the position to work.
Here is the part that does not fit on a chart, and it is the reason the size is small.
On the August 31 close, $XLE sat at 89% and up 19, on top of the sector board, with $XOM posting the largest single gain anywhere on the board at plus 54. By the September 1 close, $XLE was at 98% while $QQQ dropped 73 and $XLK dropped 61. Energy did not rally so much as stand there while growth got taken apart.
Then the market flipped. On the September 3 close the Scorecard went bullish at plus 50 overall, and $XLE was one of the biggest drops in the rankings. By the September 4 close, energy was off the leaderboard entirely, with $ARKK at 92 and $XLK at 88 running the board instead.
So when I say $XLE is the number one sector, I am describing a ranking that already broke once inside three weeks. It came back by the time I entered on Tuesday, and it can leave again the same way.
The Fed Did Not Help, and Friday Is the Real Test
Wednesday’s Scorecard came in neutral to soft across the board, and I said at the time that the real tell would be where things close on Friday. After the Fed, the market ground lower, $SPX traded below the $7,600 level, and sell signals kept stacking up underneath. Below that level the bears have more edge, not less.
The day after a Fed meeting is usually a more honest read than the day of, so I am holding tight and not making any decisions quite yet. I would also be cautious about adding anything new right now, long or short.
The exit rule on the XOM squeeze trade has not changed since Tuesday. A close below the 21 EMA or the 50 SMA and I am out for a loss. No negotiating, averaging down, or waiting to see whether it comes back.
It is the same discipline that took me out of $LITE for a loss earlier this month, when price lost the level I had named out loud the day before. It will do the same thing here if $XOM gives up those lines.
Stay Focused,
Taylor Horton
John Carter’s full SPX Advantage session is on replay now. He shows how he turns market data into an intraday directional read, which is the kind of edge a choppy post Fed tape actually rewards. Watch the replay!