It’s a new year with new opportunities! Today I wanted to share more information on updates I’m making to my Big 3 Indicator and a Big 3 trade idea for this week in Mcdonald’s ($MCD).
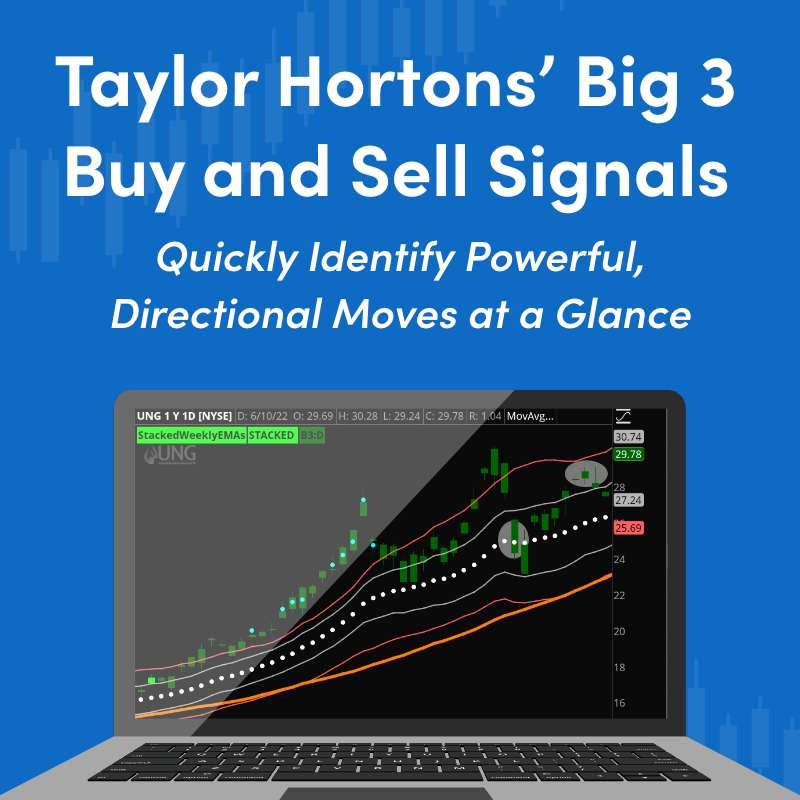
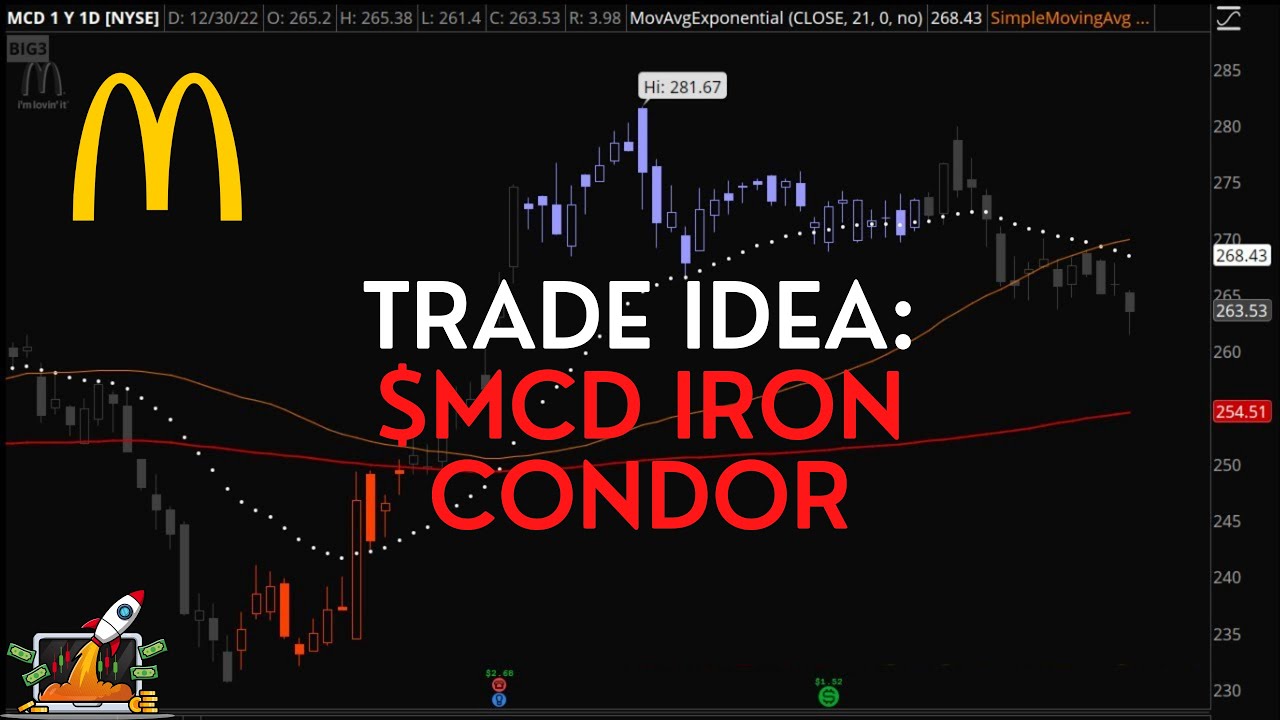
It’s a new year with new opportunities! Today I wanted to share more information on updates I’m making to my Big 3 Indicator and a Big 3 trade idea for this week in Mcdonald’s ($MCD).
Hope everyone had a great holiday weekend! It’s a short week heading into the end of the year. Initial and continued Jobless Claims will be reported on Thursday at 8:30 a.m. Eastern.
On Friday, the Personal Consumption Expenditures Price Index (PCE) will be released at 8:30 a.m. Eastern, followed by the Umich Consumer Sentiment Index at 10:00 a.m. Eastern.

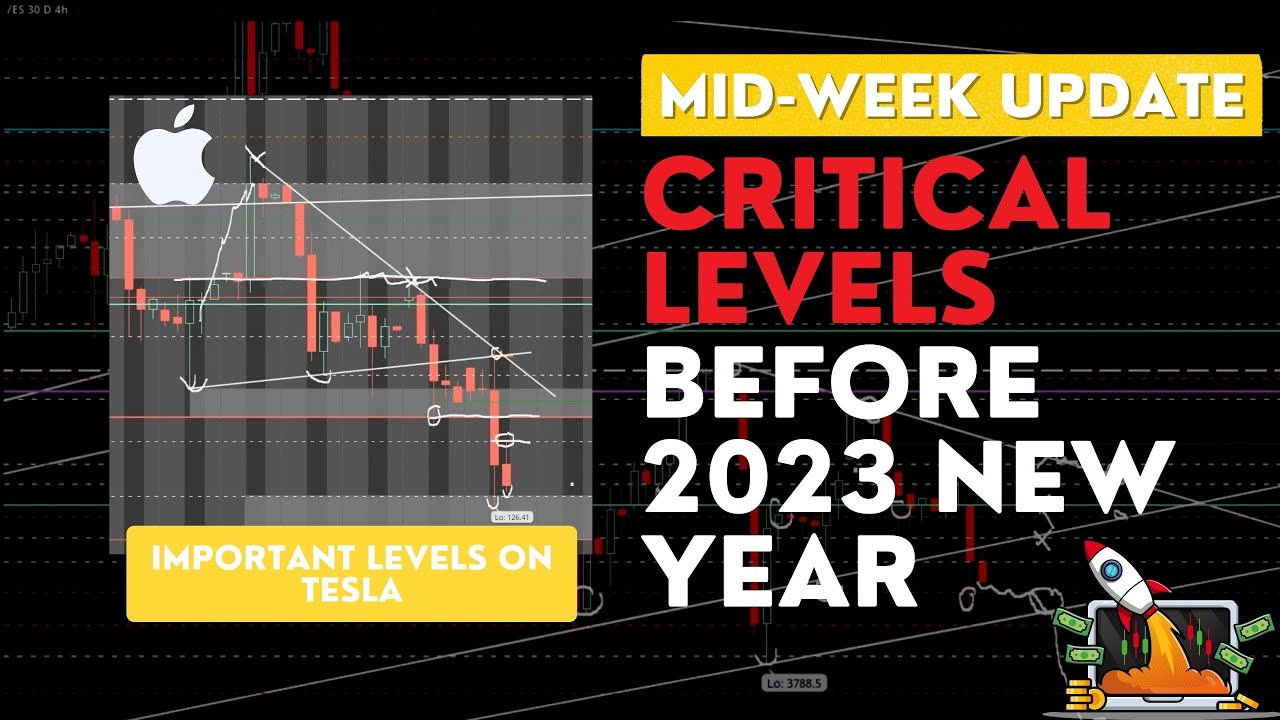
In the video above, I review /ES and the levels I observe. I also discuss critical levels on AAPL and TSLA.
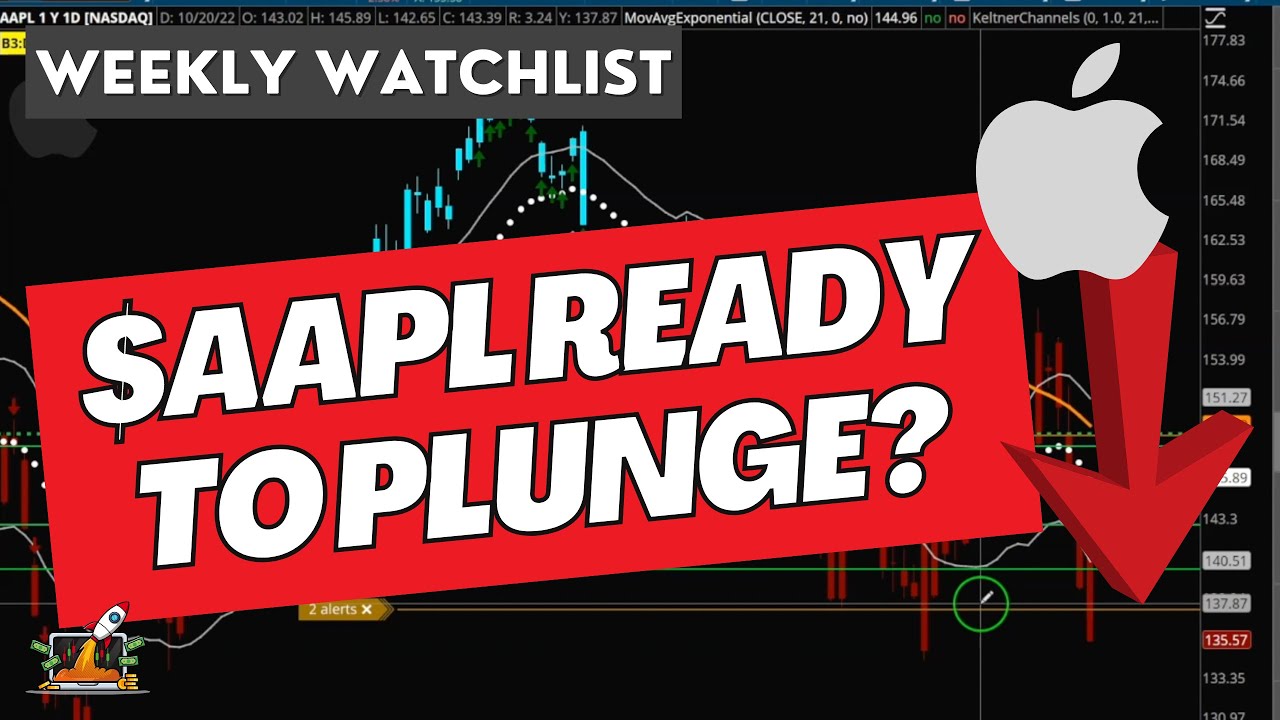
Let’s jump into the weekly watchlist for this week ahead of Christmas. Last week the bears made serious progress… The weekly chart of the SPX is showing a downtrend, and AAPL isn’t looking pretty either for the market.

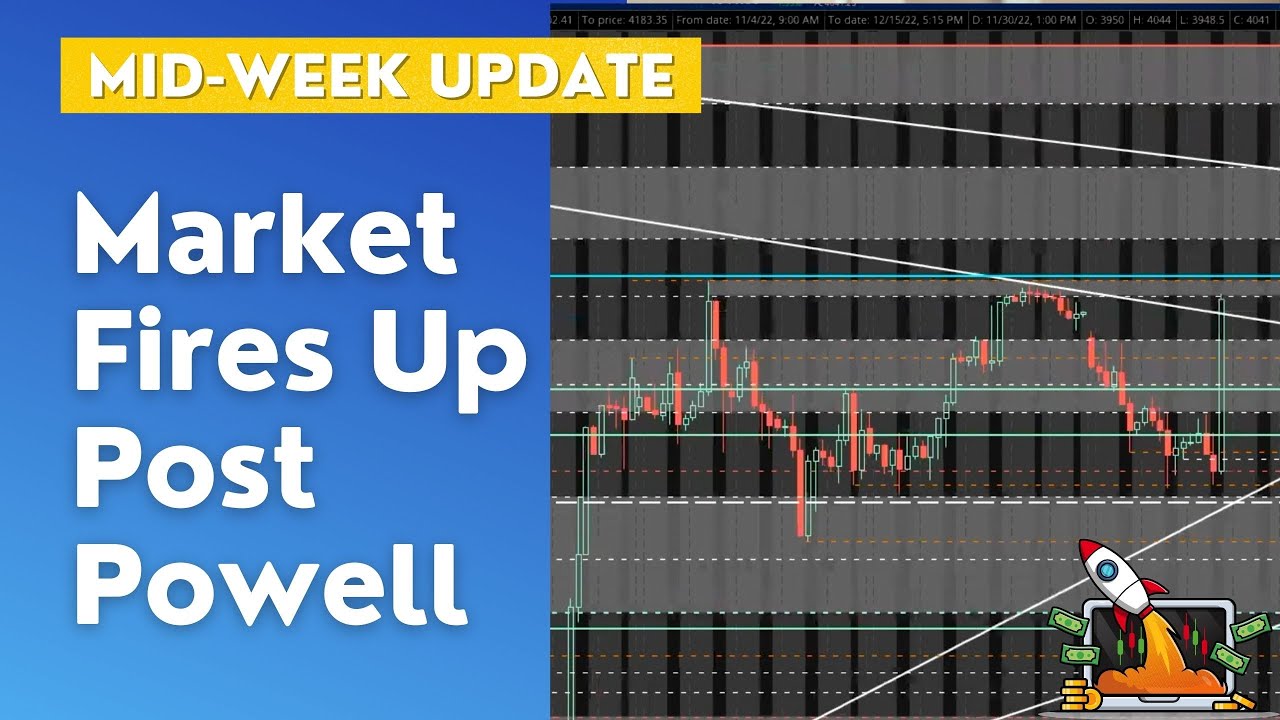
Two major events took place on Wednesday. The ADP Employment Report was released, and, more importantly, Federal Chairman Jerome Powell spoke. The market reacted very bullish to Powell’s economic outlook.
In the video above, I break down major levels I’ve been eyeing on /ES and my entry point if /ES pulls back.
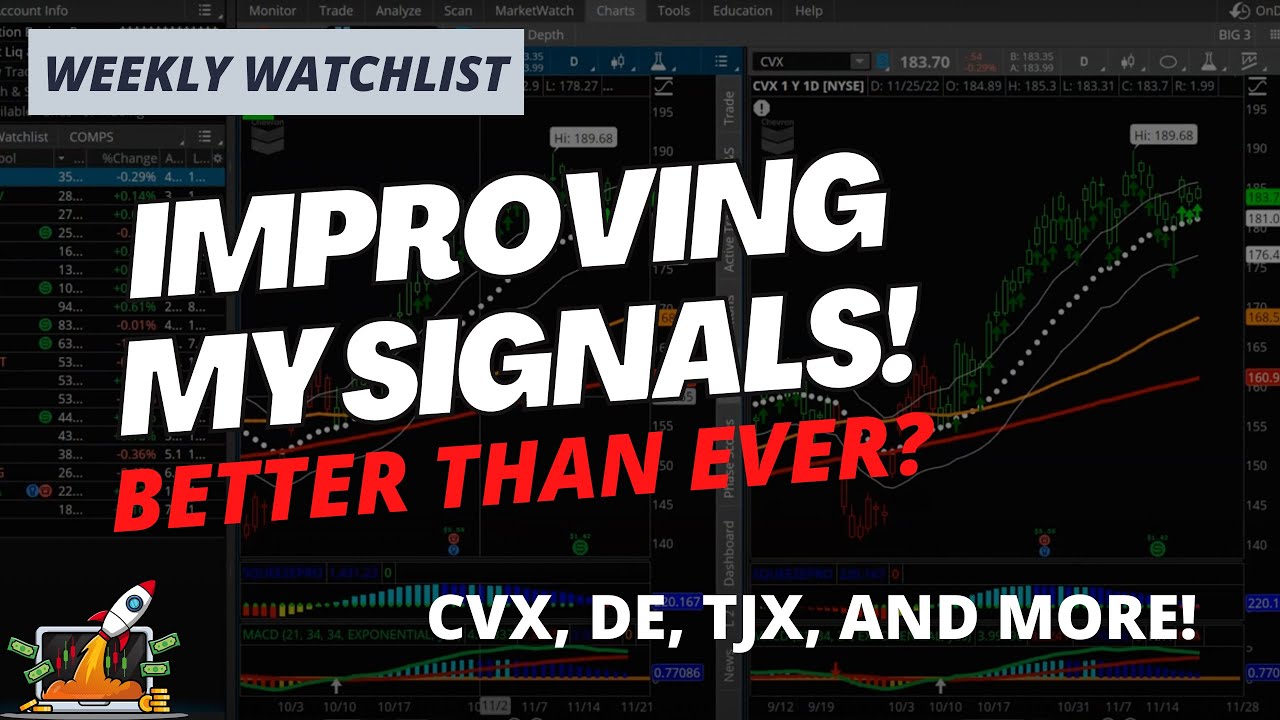
Let’s jump into the weekly watchlist for the week of November 28th. I spent the weekend tweaking the Big 3 signals, so we’ll talk through the adjustments I made. And of course, we’ll walk through the watchlist, including names like CVX, DE, TJX, and more.
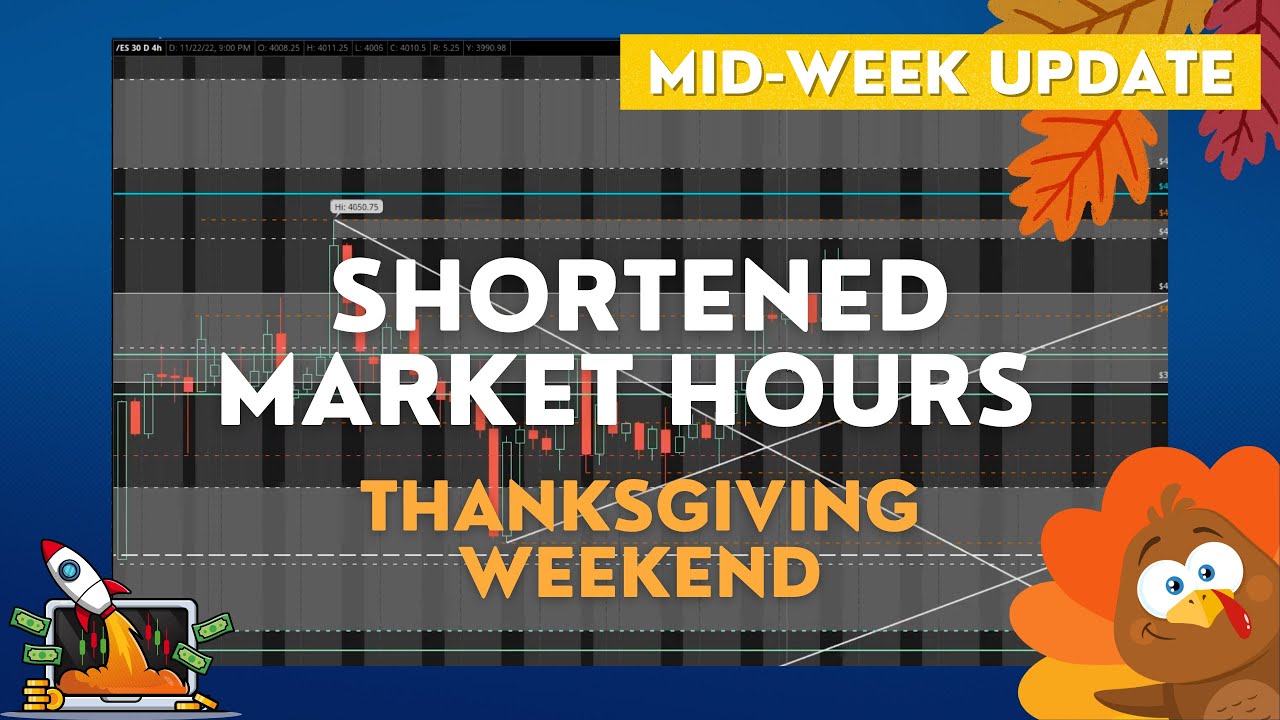
The market is closed on Thursday for Thanksgiving and closes early on Friday at 12 pm central. In this video, I break down possible outcomes for Friday’s short session and major levels to target.

Have a great Thanksgiving, and stay focused!
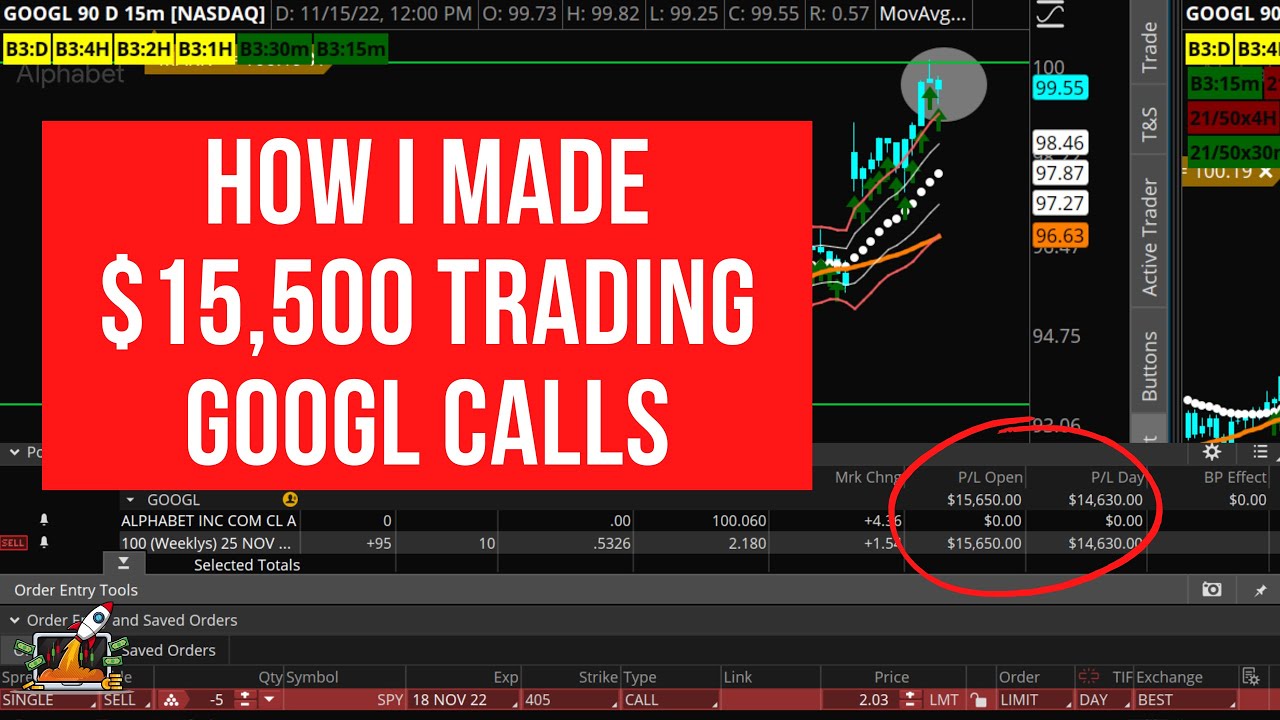
In this video, I break down how I made almost $16k in just one trade using my Big 3 signals on GOOGL. Over the next few weeks, pay attention as more opportunities like this are more likely to arise.
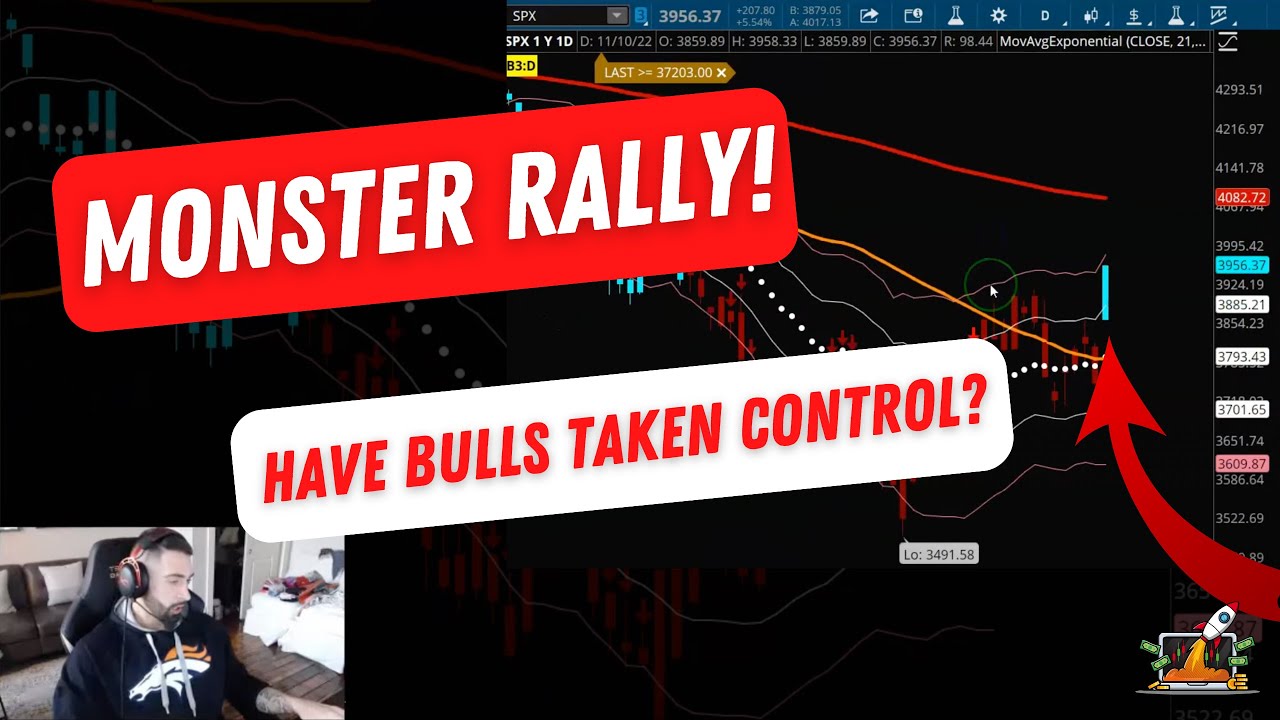
Have bulls taken control of the market? Is this rally here to stay? Check out the video above, where I dive into Thursday’s monster rally in the market after Consumer Price Index (CPI) report, how this rally affected $DXY and my thoughts on where the market could be going from here.

After Election Day on Tuesday, we still have additional economic reports releasing this week. At 8:30 a.m. Eastern on Thursday, both the Consumer Price Index (CPI) and Jobless Claims will be reported. Let’s see how the market digests all this information into the end of the week.
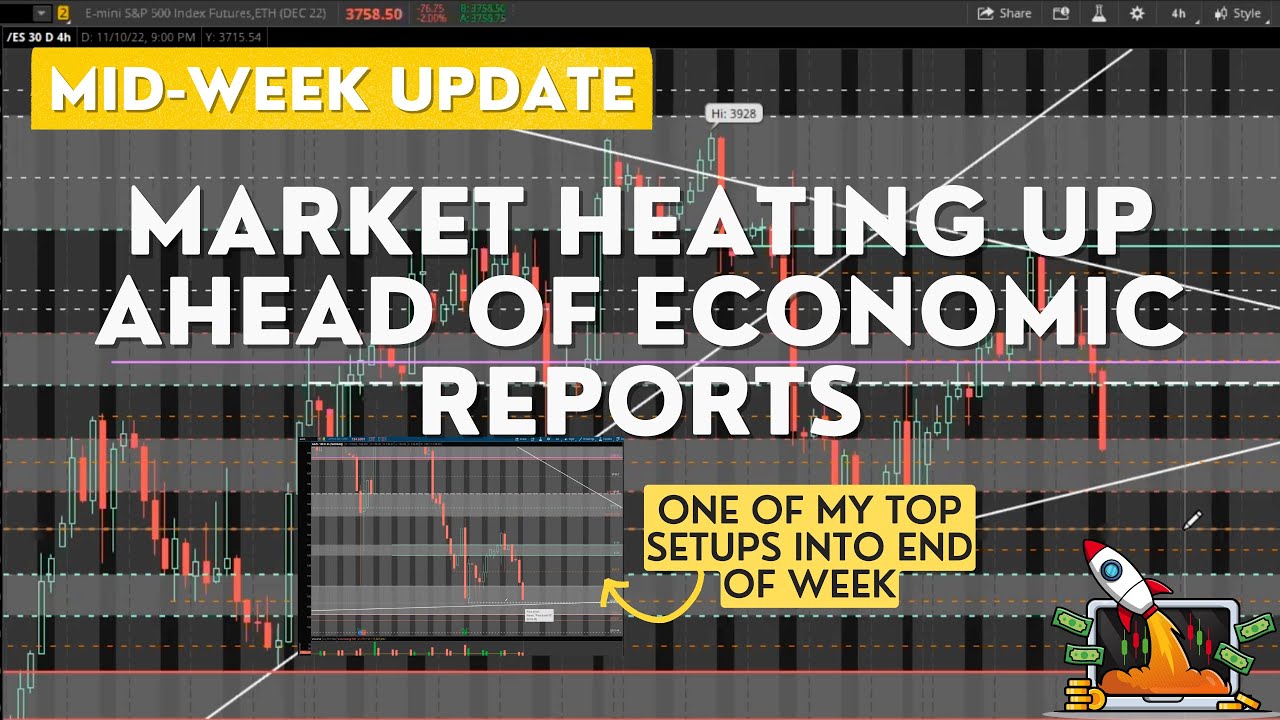
Last week the S&P 500 (/ES) hit my major structure trendline around $3,900. After the FOMC event and Powell’s speech, /ES broke $3,900 and got below the daily 21 exponential moving average (EMA) near $3,784.

As the market found its feet this week, my main target was getting back to liquidity at $3,866, the point of control (POC). Once /ES got to $3,866, it dropped and broke $3,784 during Wednesday’s session.
Will Thursday’s economic data guide the market down further or help pick it back up?
Check out the video above to get the breakdown of my critical levels on /ES. I also discuss my focus list setup on AAPL, as huge levels are in play.
Stay Focused!
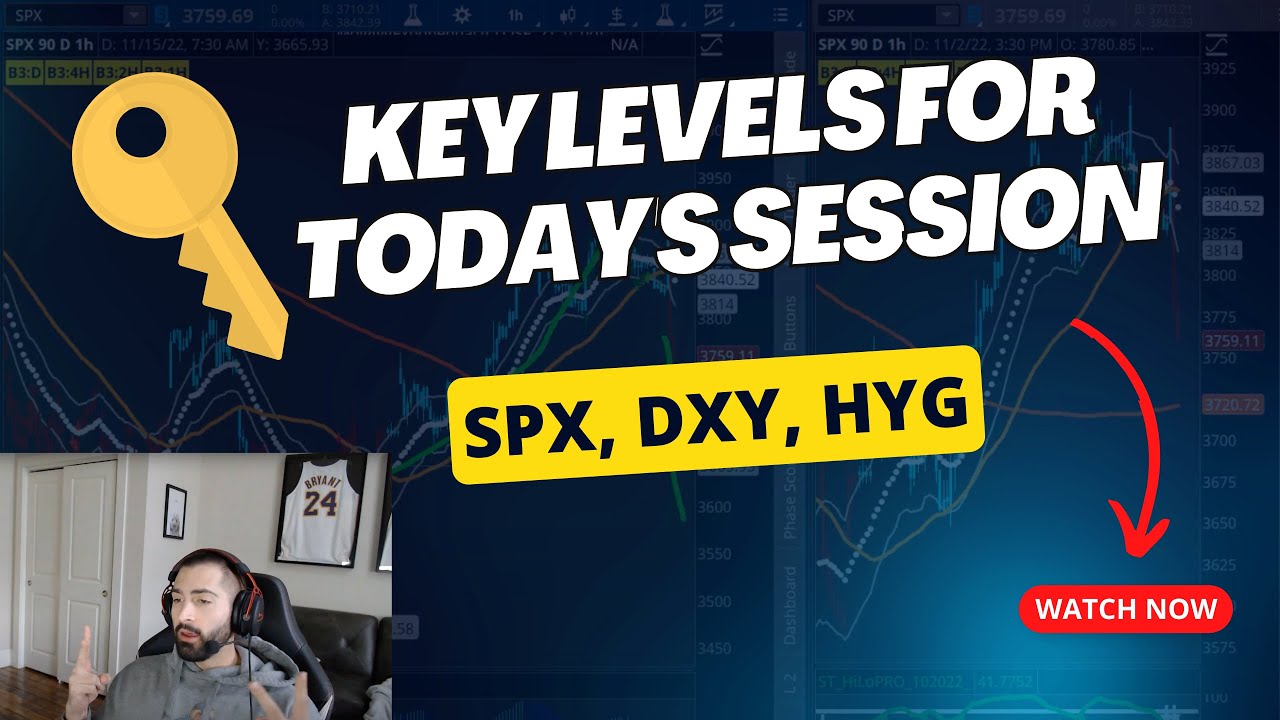
The bulls have made progress over the last week. In the short term, we could see the S&P 500 (SPX) move toward the 200 simple moving average (SMA) around $4,100. We’ll compare the market now versus in August since that was the last time the market rallied for longer than a few days. We’ll also cover some of the pieces of the puzzle including VIX, HYG, and DXY for a full market breakdown.