
My SPCX Put Credit Spread Was On The Chopping Block

The tape looked solid this morning. MU reported last night and was flat in the pre-market, and with that report behind us, QQQ, NVDA and MSFT all look breakout ready. That makes this a good week to show how I manage a position that did not cooperate right away. Let’s take a deeper look at the SPCX put credit spread:

Why SPCX Made My List

On Friday, September 18, SPCX showed up on my watchlist off the Top Bull rankings from the prior day’s close, right alongside AAPL, DELL, META, CRWD, MU, AMD, ANET and NVDA. That afternoon I sold a put credit spread on it in the Compounding Growth Rooms.

A put credit spread is a defined-risk way to lean bullish. I collect the premium up front, my max loss is set the moment I open it, and I do not need the stock to rip. I need it to hold above my short strike into expiration. That is the type of trade I like to pair with a name ranking well in my Big 3 Squeeze system.

By Wednesday, September 23, it sat in the open positions list next to ARKK, NVDA, QQQ and AVGO. I held it into the weekend on Friday, September 25.

The SPCX Put Credit Spread Hit the Chopping Block

Monday, September 28 is where it got uncomfortable. That same day Starship reached orbit for the first time, and by the afternoon SPCX was still the weakest of my open positions. I told the room it was the one at risk of being on the chopping block if it could not improve that week.

Tuesday morning I was blunt about it: not a huge fan of this one at the moment. If it could work its way back above the 21 EMA, I would let the trade work. Otherwise, it was the only open position I was ready to cut.

A position on the chopping block does not mean I panic. It means I define the line ahead of time, and I let price tell me which side of it we are on.

SPCX, Daily Chart 10.01.26

SPCX put credit spread daily chart with the 21 EMA

The Line I Drew

Early in Tuesday’s session, I set the hourly 200 SMA as the over/under level for the trade. I did not want to get shaken out on a minor dip below it, but a hard break of that level would trigger a cut of the position, and I said I would post the exit if it failed.

It did not fail. By late morning SPCX had a nice recovery off the opening lows, and I held. In Tuesday’s video I said this was the put credit spread I wanted to add to.

Wednesday, with MU earnings on deck that evening, I cut the rule down to one sentence: this is a hold so long as it does not take out the low of the week. It held that too.

The exit rule on the SPCX put credit spread never changed once it was set. I only made it shorter.

SPCX, Hourly Chart 10.01.26
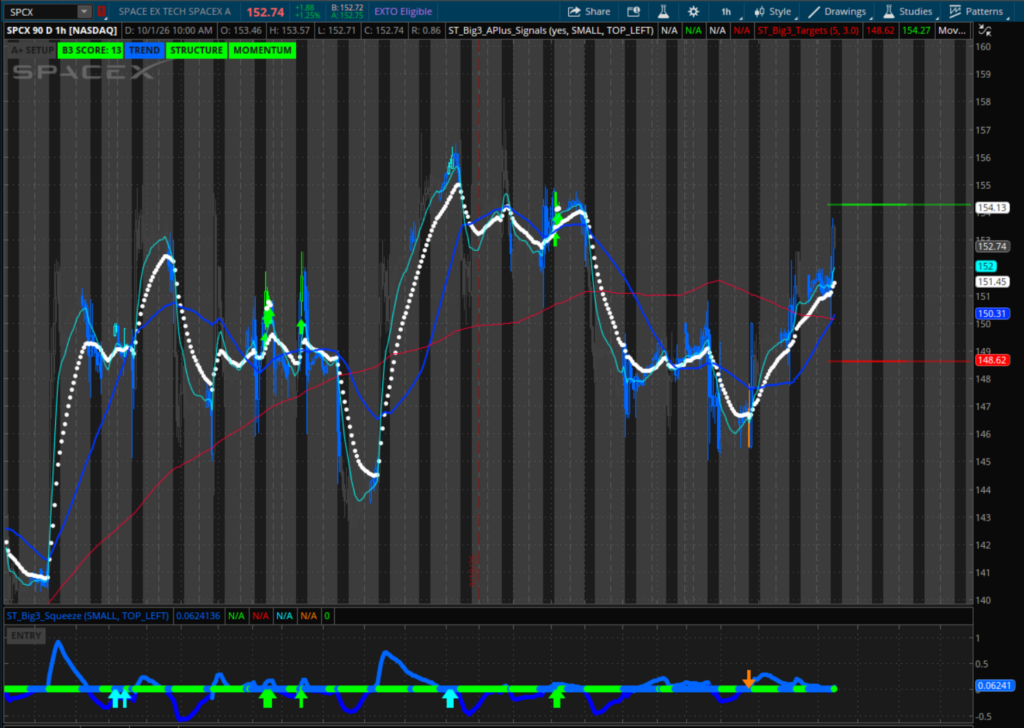
SPCX put credit spread hourly chart with the 200 SMA

Where the SPCX Put Credit Spread Stands Now

This morning I put in a GTC exit order on the SPCX put credit spread to buy it back for a profit. In four sessions it went from the one name on the chopping block to the one I am working an exit on. That order is working as I write this, and when it fills, members will see it in the room first.

The exact entry and the exit order stay in the room. What I can show here is the process, because that part does not change from trade to trade. If the order fills, the trade is done. If SPCX takes out the low of the week first, the cut happens instead, and I will post that too.

Headlines Did Not Make the Decisions

It has been a loud stretch for SpaceX. Starship’s first orbit put 26 Starlink satellites up, and the Crew-13 mission to the International Space Station was lined up for this week. None of that showed up in how I managed this trade. Every decision came off a level: the 21 EMA, the 200 SMA, and the low of the week.

Same rule as always: pick the level before the trade gets tested, then let price make the call.

Stay Focused,

Taylor Horton

Chasing a setup late can flip your risk and reward upside down. Watch the replay of Tr3ndy Jon McKeever and Melissa Beegle’s free Trendy Precision session and see the check Jon runs before every entry.
QQQ Just Fired The Buy Trigger

The QQQ buy trigger I have been waiting on finally printed today, and the momentum shift came with it. What matters now is whether that trigger is still there on Friday’s close. If it holds, the setup lines up for a push into brand new all-time highs, and my target sits near $785.

Breadth is the problem. QQQ is the only index carrying a real score on my Big 3 Scorecard, sitting near 70% of its best, while the S&Ps come in at 30 and the Dow, the RSP and IWM are all negative. Take every index together and the board reads negative 5. Take every sector ETF together and it reads negative 12. This is selective strength in the heaviest parts of the market, not the broad tape we had in April and May.

I am building the December $700 calls in QQQ and want three or four of them, with something cheaper out of the money on a dip. I also cover NVDA and the close it needs above $235, the open profit in ARKK, the put credit spread I want to add to, and the three names I am waiting on: MU into earnings, TSM at 14 out of 15, and MSFT with a target near $535. None of it gets bought without the QQQ buy trigger still in place.

The full read, the Scorecard rankings and every level are in the video below.

Stay Focused,

Taylor Horton

Entries are where most traders give the trade back. Tr3ndy Jon McKeever and Melissa Beegle are running a free live session Wednesday, September 30 at 6 PM CT on timing them better. Save your spot!

Finding Market Strength: My Open Position in $ANET

What I’m Seeing Today

Markets are holding up pretty well today, with most of the strength in tech and healthcare.

The larger timeframes are bullish. On the lower timeframes, I’m waiting for confirmation. I want to see 15-minute and hourly buy signals on key names before adding to current positions or initiating new trades. Practicing patience for now.

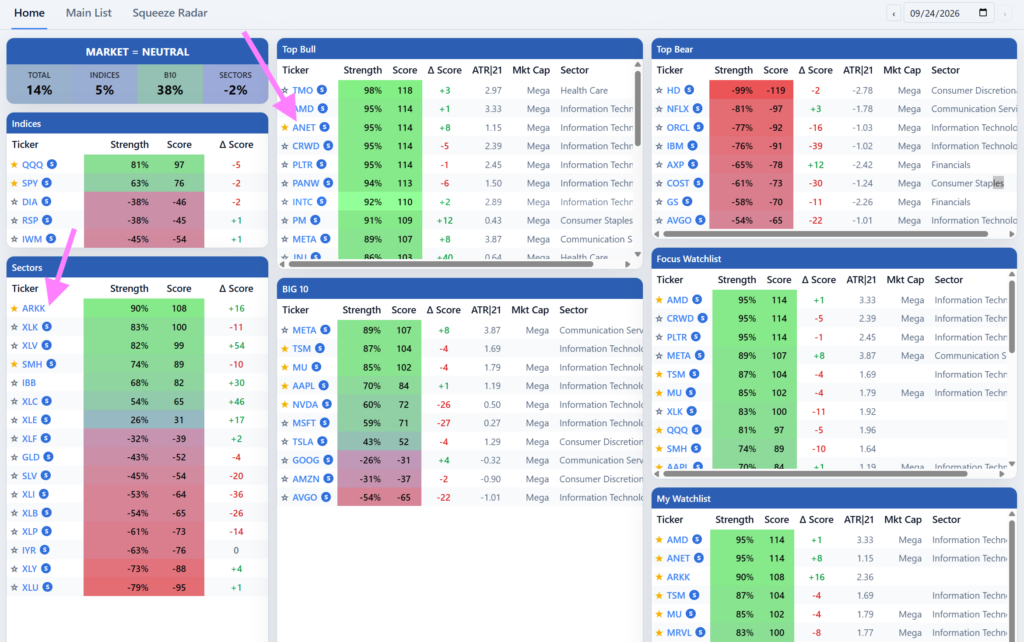
Today’s Big 3 Scorecard Rankings:

My Open ANET Trade

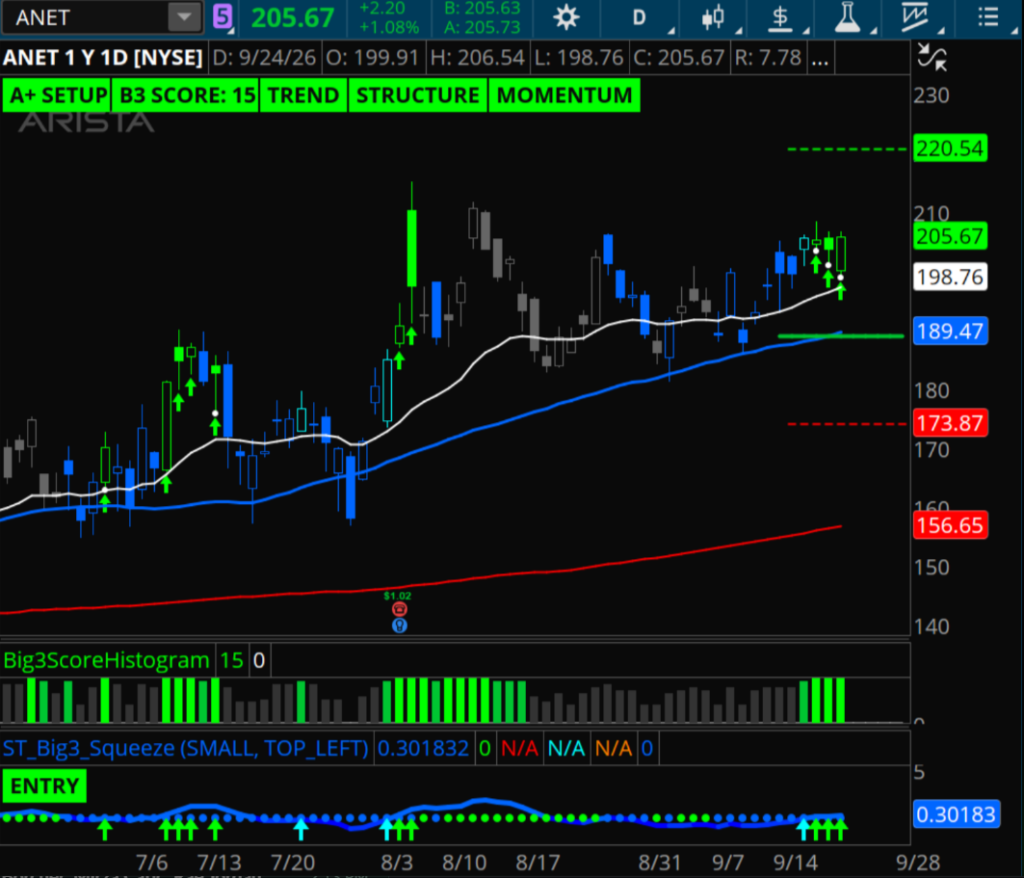
ANET, 9.24.26

ANET is currently ranked #1 on the Scorecard, with my A+ signals printing on the daily squeeze. I’m playing this setup with the 200/195 put credit spread for October monthly expiration. The setup is invalid on a daily close below the 21EMA, with an upside target is $220.

ANET is currently trading around $205 per share.

The reason I’m using the spread instead of buying a $225 call comes down to the number of ways this trade can work. If ANET explodes higher, we can still get the max profit from the spread. And if ANET simply grinds higher, we can still get max profit. Or, if ANET trades around $205 every day through expiration, we still get max profit.

There is no free lunch on Wall Street. The trade-off is that a credit spread can have a higher probability of success, but the risk can be more painful if the setup fails.

The other reason I’m using the spread is the risk of being outright short the $200 put. If ANET gaps down $100 tomorrow, that $200 put could go from $6 to $100. If we are short that put outright, that is a problem.

With the spread, the risk is defined. The setup is still valid as long as ANET holds above the 21EMA on a daily closing basis, so I’m hanging tight with the current position.

Stay Focused,

Taylor Horton

Tr3ndy Jon and Melissa Beegle went live on Wednesday to share Trendy Precision, the tool that marks entries, stops and risk zones right on your chart. Check out the replay HERE. 

Micron Looks Like April All Over Again

This market is not balanced and the Scorecard says so plainly. Equal weight $RSP reads negative 9 while $SPY sits at a positive 92, $IWM is at negative 2 and the Dow is at negative 9. Sector rankings collectively come in at 19%. Ten to fifteen heavily weighted names are carrying the entire tape.

That does not bother me as long as the Big 10 holds, and right now the basket is close to 70%. $XLK is at 98, $ARKK at 97, biotech and $SMH both in good shape. Utilities, staples and financials are the ones lagging.

I walk through every position on the book: $NVDA and $ARKK December calls, $QQQ at 14 points out of 15, the $SNDK trade off John Carter’s alert, and the $XOM loss I took Monday when the rotation turned against energy. Then I lay out the stacked Big 3 Squeezes building across $MU, $NVDA, $SMH and $QQQ, and what happens to the chips if $QQQ and $SMH fire together.

The video has the charts and the full read on the Micron setup.

Stay Focused,

Taylor Horton

Tr3ndy Jon and Melissa Beegle go live Wednesday at 6 PM CT on Trendy Precision, the tool that marks entries, stops and risk zones right on your chart. Grab a seat before it starts!

My XOM Squeeze Trade And The One Close That Ends It

Energy is the one group that has held up while everything else softened, and it’s the place where I’ve put new money to work this month. On Tuesday I opened an October at the money call on $XOM in the Compounding Growth Rooms. Two sessions later the Fed came and went, the broader tape rolled over, and I have not touched the position. Let’s take a deeper look at the XOM squeeze trade: why I own it, what has to keep working, and the one thing that takes me out.

Why I Took The XOM Squeeze Trade In The Top Ranked Sector

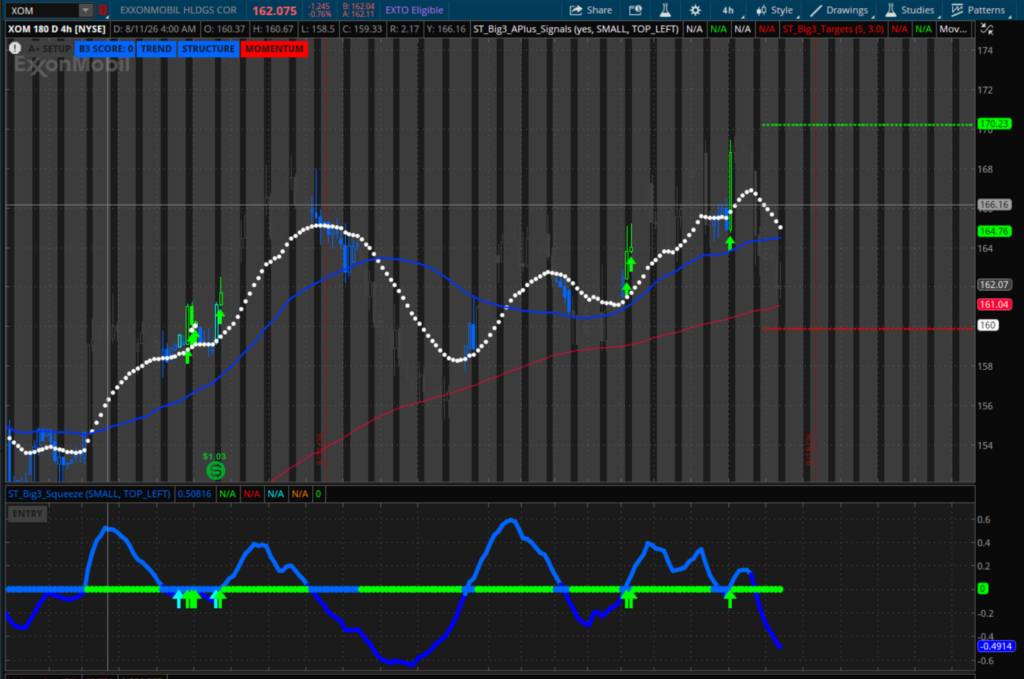
XOM, 4HR Chart 09.17.26
XOM squeeze trade setup on the 4hr chart

This is the setup I was stalking, with the 21 EMA (dotted white) and the 50 SMA (solid blue) marked, and the A+ entry being shown on the chart. 

The construction here is simple. $XOM printed an A+ Big 3 Squeeze setup, and $XLE was ranked the number one sector at the time I entered. That is the whole thesis: take the best setup inside the group that is actually being bought.

When I posted the trade Tuesday, $XLE was running at 98% of its best ranking, big tech was sitting at 8, and semiconductors were at negative 42. Those three numbers are the entire case for being in energy instead of tech.

I also posted it with an instruction attached: size this small enough to accept the max loss based on the current market ranking. When the overall market score is neutral, the setup can be A+ and the position still has to be small.

Energy Has Already Failed Once This Month

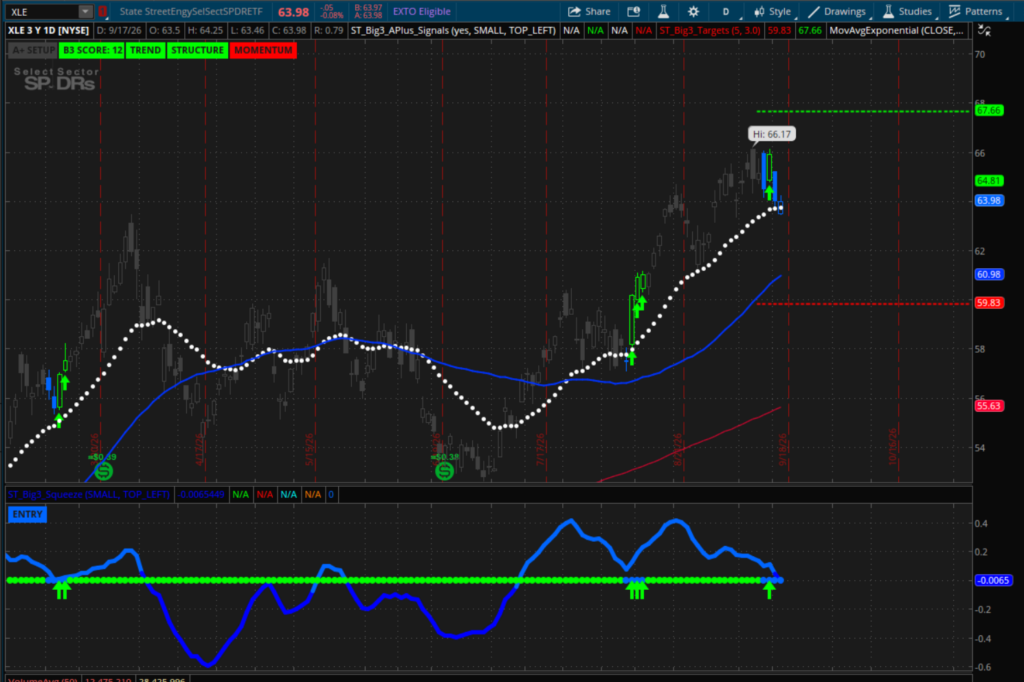
XLE, Daily Chart 09.17.26

XLE daily chart showing the energy sector leadership behind the XOM squeeze trade

The sector ranking is what earned $XOM the entry. This is the group I need to keep leading for the position to work.

Here is the part that does not fit on a chart, and it is the reason the size is small.

On the August 31 close, $XLE sat at 89% and up 19, on top of the sector board, with $XOM posting the largest single gain anywhere on the board at plus 54. By the September 1 close, $XLE was at 98% while $QQQ dropped 73 and $XLK dropped 61. Energy did not rally so much as stand there while growth got taken apart.

Then the market flipped. On the September 3 close the Scorecard went bullish at plus 50 overall, and $XLE was one of the biggest drops in the rankings. By the September 4 close, energy was off the leaderboard entirely, with $ARKK at 92 and $XLK at 88 running the board instead.

So when I say $XLE is the number one sector, I am describing a ranking that already broke once inside three weeks. It came back by the time I entered on Tuesday, and it can leave again the same way.

The Fed Did Not Help, and Friday Is the Real Test

Wednesday’s Scorecard came in neutral to soft across the board, and I said at the time that the real tell would be where things close on Friday. After the Fed, the market ground lower, $SPX traded below the $7,600 level, and sell signals kept stacking up underneath. Below that level the bears have more edge, not less.

The day after a Fed meeting is usually a more honest read than the day of, so I am holding tight and not making any decisions quite yet. I would also be cautious about adding anything new right now, long or short.

The exit rule on the XOM squeeze trade has not changed since Tuesday. A close below the 21 EMA or the 50 SMA and I am out for a loss. No negotiating, averaging down, or waiting to see whether it comes back.

It is the same discipline that took me out of $LITE for a loss earlier this month, when price lost the level I had named out loud the day before. It will do the same thing here if $XOM gives up those lines.

Stay Focused,

Taylor Horton

John Carter’s full SPX Advantage session is on replay now. He shows how he turns market data into an intraday directional read, which is the kind of edge a choppy post Fed tape actually rewards. Watch the replay!

Bears Have Full Control Of Everything Except This One Group


Going into the Fed, the honest read is that the short term does not look good. The long view is still bullish and that is the one thing the bulls have going for them right now, though it does not help me this week. Bears have control of everything shorter, and it is all playing out under daily levels I care about. I am not short. I am also not buying this.

Energy is the only place on the buy side I would put money right now. $XLE is running at 98% of its best ranking while big tech sits at 8 and semiconductors sit at negative 42. The entire board is at negative 8% of its best, and that is a long way from the April and May tape where we were printing 70 and 80 almost every day.

I opened an October at the money call on $XOM in the room today. A squeeze fired long, there are more stacked behind it, the peer group is strong across $CVX, $COP, $MPC and $EOG, and the bigger charts are in far better shape than anything in tech. A close below the 21 EMA or the 50 SMA and I am out for a loss. I walk through the two risks that would break this trade, plus where $ARKK and $NVDA stand for December.

Full breakdown is in tonight’s video.

Stay Focused,

Taylor Horton

John Carter goes live tomorrow night with SPX Advantage, and it is the last session of this run. He is showing how he reads the market data and turns it into actual trade ideas. Register for free here.

The NVDA Flush I Am Waiting For

Leadership has been narrowing for weeks, and the indices are hiding it well. Underneath the surface a small group of names is carrying the entire tape, equal weight has been rolling over the whole time, and this morning the /NQ came back down to support at $29,000. A hard break below that level tells me the narrowing has finally started doing real damage.

The Trade I Have Not Touched in Five Weeks

NVDA, Weekly Chart 09.10.26

This is the setup that put me in. Stacked EMAs, price holding above the 21 EMA, and a Big 3 Squeeze underneath it with room to run into $250.

I have been long $NVDA December calls since the first week of August. It was a Big 3 Squeeze setup with a path into $250, and I treated it as a longer term swing from the day I put it on, risking the debit paid and nothing more. I ended up taking only half the size I wanted. The plan was always to add the other half on a meaningful dip.

The dip never came. The stock went straight up through August, which sounds like a good problem until you realize the trade never gave me the chance to finish it. When earnings landed on August 26 and $NVDA gapped into $225, it put up the biggest single move on my Scorecard that day. There was still nothing to do.

The Flush I Want Is the Flush That Could Break This Market

NVDA, Daily Chart 09.10.26

Where NVDA stands now. The move off the earnings gap held, and price is sitting well above where I got in, which is exactly why there has been no entry to add.

I want to add, but I am not going to force it. What I want is a hard flush with the squeeze pattern still intact underneath it. The catch is that the flush I need may be the same flush that breaks the tape. FOMC hits Wednesday, September 16, and anything goes into that print.

If the /NQ holds $29,000 and the pattern holds with it, that dip is where I finish the position. If $29,000 goes, the bears have the edge and the flush I was waiting on is something else entirely.

I posted this trade in both the Compounding Growth Live Trading Room and the Compounding Growth Alerts Room the morning I took it, and every update on it since.

What Would Change The Trade

I am risking the debit paid and nothing more, so there is no stop to get hit and no level that forces me out. What I am watching is the pattern. So long as the Big 3 Squeeze structure stays intact, the trade stays on and the plan to add stays live. If that structure breaks while the market is breaking with it, I stay at half size and let the December time do the work.

Five weeks in a winner and the only correct move has been to leave it alone, right up until the tape tells me which flush I am getting.


Stay Focused,

Taylor Horton

John Carter walked through the SPX data he uses to build an intraday directional read, and the replay is up. That is the stuff most traders never get to see. Watch the replay here. 


The Big 3 Squeeze Setup I Just Bought For December

Back from the long weekend, and the theme has not changed: leadership is narrowing. Big tech and energy still rank at the top of the Big 3 Scorecard, financials took the hardest hit today, and biotech and healthcare are not close. QQQ, the Invesco QQQ Trust, sits at 74% while RSP, the equal weighted S&P 500 basket, sits at negative 2. That gap tells you a handful of names are keeping the entire ship afloat.

I opened a brand new position in ARKK, the ARK Innovation ETF, on the back of a Big 3 Squeeze that finally has all three pieces. Momentum was the one holding it back, sitting on the sell side ever since the MACD turned negative last November, and the bull shift printed a couple of weeks ago. Structure, trend and momentum inside a squeeze gets me a perfect 15 out of 15, so I bought a mix of in the money and out of the money December calls looking for $95 to $100. The idea is wrong under $78 and change.

The rest of the board is built and waiting. NVDA is still one of the better charts I own, and I am holding the December $200 calls. AMD, Advanced Micro Devices, Taiwan Semiconductor, Micron, Dell and SanDisk are all coiled up on the same condition: QQQ and SMH, the VanEck Semiconductor ETF, printing buy triggers of their own. QQQ scores 13 of 15 with no momentum, and a MACD line back above zero opens the door toward $780.

That is what I am being patient for. Roughly 80% of the time this market chops you back and forth, and the other 15 to 20% is where clean direction and easy price action show up, which almost always starts with a big squeeze on the indices. Every chart I mentioned is broken down in the video.

Stay Focused,

Taylor Horton

John Carter goes live Wednesday at 6pm CT on the SPX data he uses to build an intraday directional read. That is the stuff most traders never get to see. Register here!

BIG Moves Are Coming

September opened with the Scorecard at market neutral, so I am cutting my size in half and leaning short term. Healthcare, biotech and utilities held up today. Technology, the chips and communications did not.

Short term I have to respect the charts. $QQQ, the Invesco QQQ Trust, is under the trailing stop, under the 21 EMA, under the 50 SMA, MACD below zero, with sell signals on the 2 hour, 30 minute and 15 minute. My target is around $695 unless the bulls take back $714 to $715 quickly.

Here is why I am not bearish underneath that. $QQQ, $SMH, $NVDA, $MU and $AVGO all loaded brand new weekly squeezes, weekly $QQQ reads 13 out of 15, and $SMH reads 12 out of 15. In ten years of trading, the fired weekly squeeze is the setup that has paid me the most. My job now is to stay in one piece until it triggers.

$AAPL, Apple Inc., is the exception worth trading today: new daily squeeze, first MACD shift in about a month. I break down the $315 line, how I would scale in, and my open positions in NVIDIA and Broadcom in the video below.

Stay Focused,

Taylor Horton

TG Watkins built the Moxie Indicator to catch swing moves before the crowd sees them, and he is breaking down exactly how the alerts work in a live session. If you want a systematic way to spot the next leg instead of chasing it, this is worth your seat. Registration is free.

Nvidia Earnings Could Make Or Break This Market

The market closed Tuesday still stuck in neutral bullish territory. The indices sit at 58%, the sectors at 54, and the Big 10 basket all the way down at 12, and that spread is the single biggest issue on the board. Financials, healthcare, biotech, and the ARK ETF all look strong, but the names that actually make a good market are leaving a lot to be desired.

Today’s recap covers the two risks of being long what is currently relative strength, especially with Nvidia earnings landing tomorrow night. Either big tech weakness drags everything lower, or cash rotates back into the big boys and pulls the rug on the rotation trade.

The bigger story is the brand new QQQ weekly squeeze. These do not tend to fire the next day, and they do not tend to end in small moves: the basic ATR targets sit near $780 on the upside and $600 on the downside.

The full breakdown, with every chart and level, is in the video below.

Stay Focused,

Taylor Horton

TG Watkins built the Moxie Indicator to catch swing moves before the crowd sees them, and he is breaking down exactly how the alerts work in a live session. If you want a systematic way to spot the next leg instead of chasing it, this is worth your seat. Registration is free.