focused-trades-logo-w-taylor
focused-trades-logo-MOBILE

SPY: $420 or Bust


For the last few weeks we’ve been discussing the potential of a short squeeze in the markets. That’s exactly what we saw on Thursday and Friday of the 3-day weekend. 

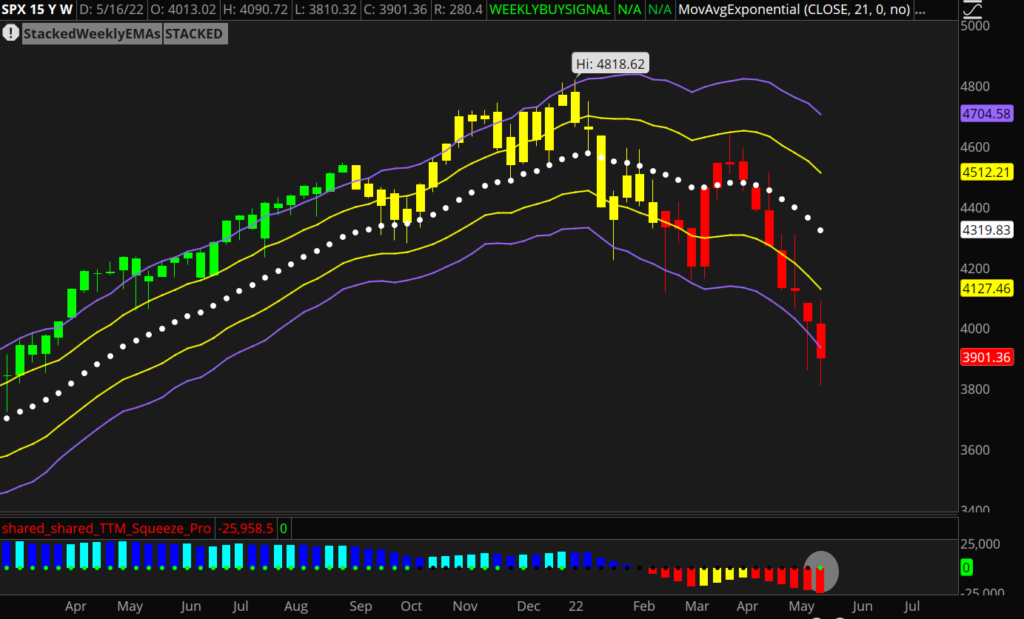
Bear market bounces are fast, brutal, and can last longer than anyone who’s holding short positions would like to bear (no pun intended). The key, however, is to see these bounces for what they are. So long as the weekly structure remains bearish, these bounces can make for some of the best shorting opportunities in a downtrend. 


SPY Daily Chart


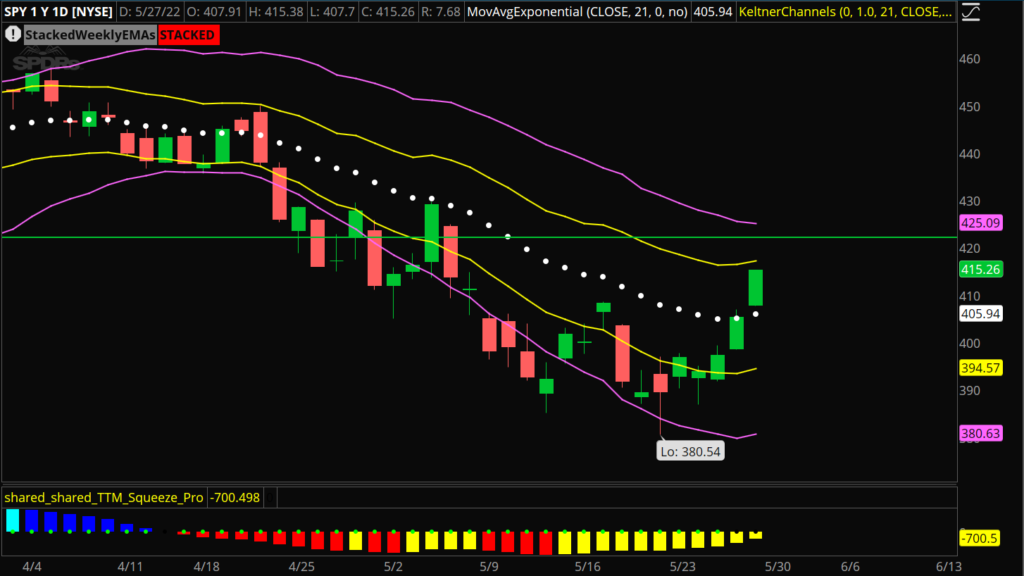
Looking at the SPY, it looks like it could have cleared itself a path for a push into $420 next week with Friday’s close above the daily 21 exponential moving average (EMA). While our major focus will be shorting this bounce, remember that these reversion-to-the-mean moves can make for solid, albeit short-lived, long positions. 

On Friday afternoon, we bought a 6/03 expiration call debit spread on the SPY in the Compounding Growth Mastery. Should we get the push into $420+, the trade should net a 200% to 300% return. We’ll look to parlay those profits into new shorts.

As for structuring shorts, we’ll be looking for initial entries in July expiration call credit spreads with a simple risk management plan. So long as the market is trading under the weekly 21 EMA, we’ll continue scaling into shorts looking for the next flush to new lows. 

The overall market might be as bearish as it’s been in a while, but there continues to be great setups looking poised for more upside. XLE, USO, and XEL are just a few examples we’ll cover in this Sunday’s watchlist video!

Stay Focused!


Reversion to Mean, Short Week Ahead


Now that the market has digested the FOMC minutes and NVDA earnings, we’re ready to take on whatever the market brings next on Friday.

In this video, we’ll break down the S&P 500 (/ES) daily chart to show similar patterns over the last two days. This gives us more clarity and confidence moving forward.

We’ve seen the market hit a key level, flush below it, and make a strong recovery for a reversion to the mean. This is an important lesson of how price acts at large key levels.

After a big flush to $3,855, we saw /ES seek out liquidity in a cover pop type fashion. What we mean by liquidity is price working toward point of control (POC) and the daily mean (21 exponential moving average).

Regardless if we’re bullish or bearish, this is the area we want to step back, reanalyze, and prepare for what can happen next.

We’ll review the major indices and cover a few setups on our focused list on NVDA and SHOP.

Stay Focused!


Fresh Week: NVDA Earnings, FOMC Minutes


After a choppy week of options expiration (OPEX) this week, a few catalysts are to note. 

Federal Reserve Chairman Jerome Powell is giving welcoming remarks on Tuesday afternoon. This pre-recorded event will likely not be a significant market mover, but it is worth keeping an eye on.

More importantly, the Federal Open Market Committee (FOMC) minutes will be released on Wednesday. This is a chance for the algorithm to react to the minutes without having Powell speak afterward.

We’re focusing on two names recording earnings this week. Both NVDA and SNOW will report earnings on Wednesday night.

As for the overall market, we’re focusing on similar key zones.

As long as the S&P 500 (/ES) is above $3,855 (the low from two weeks ago), the market could work its way back toward liquidity. Point of control (POC) is near $4,013, and the daily mean (21 EMA) is above near $4,070.

If /ES breaks below $3,855, the market will become extremely vulnerable. We’ll look for it to drop to last week’s low at $3,807.50 and potentially hit $3,796 and $3,760.

In the video above, we’ll discuss the key zones on the major indexes and share charts with our favorite setups.

Here is our focused list:

NVDA — Be patient heading into earnings. See if it can work its way back to liquidity at POC near $174. We’ll look to trade NVDA off the low at $156.

SHOP — There are three main levels of liquidity that we are eyeing: the current POC at $360, a prior POC at $340, and another prior POC at $401. We’re planning on buying SHOP and playing it back up to the range from $383 to $400 before it potentially reverses.

ROKU — With any dips, look to play ROKU up to POC and the daily mean near $96. Above this, we’ll look for $103 to $106.

Stay Focused!


SPX Squeeze Fires Short


The S&P 500 (SPX) put in a new low at $3,810 and bounced into the close on Friday. Now the question becomes if we can get a bounce to the 21 exponential moving average (EMA). 

The SPX is trading below the weekly 21 EMA for the first time since COVID-19 started. This represents a large shift in trend and structure. 

If we consider the bearish squeeze firing, we have even more reason to believe the path of least resistance could be to the downside.

In the video above, we’ll lay out where we’d like to short SPX along with other setups on our focused list like AAPL, TXN, and more.

Stay Focused!


Top to Bottom


As of today’s close, many of the bearish weekly squeezes we discussed last week have officially fired short. This adds to the list of reasons we’re looking for a continuation lower.

Remember, the rule-of-thumb with a squeeze is once it fires, we’ll typically see 5 to 8+ weeks of momentum. Given these are weekly squeezes, there’s the potential for 5 to 8+ weeks of momentum to the downside. That’s momentum we want to ride.


SPX Weekly Chart


AAPL Weekly Chart


Two examples of big (and important) weekly squeezes firing short are SPX and AAPL, as shown above. We’d like to short both of these names on the next bounce. There are similar setups all over the place, but these are the two we’ve decided to focus on.

Keep in mind that it isn’t just the weekly charts setting up for further downside potential. 

As of this week, we’re also starting to see monthly charts lose structure with moves well under the monthly 21 exponential moving average (EMA). This alone is a huge shift of trend and structure, all in favor of the bears.

As for how we’ll look to short any bounce, July expiration put debit spreads and call credit spreads will be our strategy of choice. As always, we’ll aim to work our desired risk: reward.

Stay tuned for the Sunday video, as we’ll price out a few trades together that we’re looking at.

Stay Focused!


OPEX Coming to End


It’s been a volatile and exciting trading week due to options expiration (OPEX). 

This week’s price action captures what we can expect during OPEX and volatile times. The market has seen chops, pops, and a big drop.

After the S&P 500 (/ES) dropped near $3,855 on Wednesday, the question now is if we see another significant move on Friday.

For the market to pop, the /ES has to break through the $3,900 and $3,928 range. Then we could see a push to the $3,980 to $4,000 zone.

If the /ES rejects the zone from $3,900 to $3,928, we’ll look for the market to retest the low from last week at $3,855. Below this level, the market could fall to $3,843.


Remember the importance of liquidity and major zones. Trading zone to zone can be especially useful during a volatile OPEX week.

In the video above, we’ll review the price action and zones of the major indexes and the SHOP setup we’re keeping an eye on.

Stay Focused!


OPEX Week, Liquidity Levels


This week we are anticipating options expiration (OPEX) on Friday, May 20. 

Big money likes to take advantage of options expiration to cause chop and keep price near liquidity. This week, keep this in mind to either stay out of trouble or take advantage of this event.

It’s important to be aware of OPEX as it ties in with trading around liquidity. 

The point of control (POC) for the S&P 500 (/ES) dropped to $4,013.50. On Monday, /ES spent most of the day trading around this POC level.

On Tuesday, we have two catalysts that could impact the market. First, we’ll have a member from the Federal Reserve speak at 8:00 a.m. Eastern. At 8:30 a.m. Eastern, retail sales from April will be reported.

In the video above, we’ll lay out potential scenarios we could see this week with OPEX and lay out our next liquidity targets and key zones.

Here is our focused list:

SHOP — If SHOP pops and fails at $383, we’ll target $355 to POC at $340. If it pops and breaks through $383, we could see SHOP hit POC at $401 and reach the $430 to $440 range.

ROKU — As long as ROKU is below the $103 to $98 zone, look for a drop to $88.50 and $83. If ROKU holds $92, it could pop to the mean at $98.

Stay Focused!


Continuation of Strength?


Will the market get a continuation of Friday’s strength?

This move would be ideal for us to short the bounce as we want to enter our short positions at the 21 exponential moving average (EMA). 

The S&P 500 (SPX) has a weekly squeeze that hasn’t fired short. This weekly squeeze has the potential for 5 to 8+ weeks of downside momentum.

In the Sunday watchlist video above, we’ll lay out where we’ll look to short the move on SPX and review names with similar squeezes on TSLA, AAPL, AMZN, and GOOGL.

Stay Focused!


Here Comes Short Squeeze


After relentless selling all week, the markets finally rallied on Friday, setting the stage for a short squeeze next week.

The indices and many leading names reached deeply oversold levels on Thursday. While that is the moment in time when things feel as bearish as possible, it’s typically not the best time to get short. Getting short “in the hole” puts a trader in the position to fall victim to the oversold bounce, just like we saw on Friday.

The ideal time to short is on the bounces into falling 21 exponential moving averages (EMA). Should Friday’s strength continue into next week, that’s exactly what we’ll be looking to do. While there are a lot of bearish setups on our watchlist, we’ll likely focus on the S&P 500 (SPX) for our next bearish positions.


SPX Weekly Chart


Looking at the weekly chart of the SPX above, notice that it is setting up in a bearish squeeze under the 21 EMA. Remember the rule of thumb with squeezes: once a squeeze fires, the move tends to last for 5 to 8+ bars. 

Given that this is a weekly squeeze, there’s the potential for 5 to 8+ weeks of momentum to the downside. We aren’t just seeing this setup in the SPX. TSLA, AAPL, AMZN, and GOOGL all have similar squeezes.

Because of these weekly structures, we want to short the next bounce toward the daily 21 EMA. Shorting into the strength will offer the best risk-reward on debit spreads or credit spreads. This will allow us to catch the “meat of the move”.

Keep a close eye on things next week, and be ready to consider getting short positions working should the SPX rally into the $4,150 to $4,200 range.

Stay Focused!


Down We Go, Watch AAPL


The S&P 500 (/ES) continued to drop lower on Thursday. The /ES opened below the weekly Ichimoku Cloud for the first time since COVID in 2020.

Although the market is extended to the downside, this doesn’t mean price will head toward liquidity. Instead, we want to focus on the next pop setting up for a better short opportunity. 

Pay close attention to the $3,900 range. If the /ES breaks through this range to $4,000, we could see it head toward $4,029 and $4,055. If the /ES fails at $3900, it could roll over to $3,840 and $3,800 next.


In the video above, we’ll lay out key zones on the major indices, the volatility index (VIX), and names on our watchlist like SHOP, GOOGL, and AAPL. We’ll use these inflection points as our compass heading into Friday. 

We’ll see you tomorrow morning for live premarket prep on the Focused Trades Youtube before we look to take action in the Simpler Day Trading room together.

Stay Focused!