The final catalyst for the week is the Nonfarm Payroll (NFP) job report set to report pre-market on Friday.
The market worked its way back to the daily mean at the 21 exponential moving average (EMA) and rallied to the high of the week on Thursday.
If the S&P 500 (/ES) breaks above the trendline near $4,212 to $4,220, look for it to reach the 50-day simple moving average (SMA) and $4300.
Follow the market and target structure. In the video above, we’ll review the price action of the major indexes and volatility and review setups on NVDA, SHOP, and APPL.
The shortened holiday week ahead means less time to take advantage of setups and cheaper premium for options. Now that we are almost through earnings season, we have a regular and volatile week ahead with a few upcoming catalysts.
On Wednesday afternoon, the Federal Reserve will release the Beige Book. For the rest of the week, it’s all about jobs.
On Thursday morning, we’re going to have the ADP Employment report. On Friday morning before the bell, we have the Nonfarm Payroll (NFP) report released. These are both two catalysts to keep an eye on this week.
In the video above, we’ll cover the major indices after a strong close on Friday and review setups on our watchlist.
Here is our focused list:
NVDA — If NVDA pulls back to the daily mean and finds support, it could break through $189 to the $195 to $200 range. If it breaks below the daily mean, there might be chop or selling pressure to $170.
SHOP — This has been a weak name that hasn’t reverted to the daily mean often. See if SHOP could work its way back toward its 21 exponential moving average (EMA) and revert to the mean to $400. After this, we could see a push to $450 and $470. Until SHOP is back above $413, it is in a vulnerable range. To the downside, we could see SHOP rollover to the $300 range.
The market will be closed on Monday, May 30th, for Memorial day weekend. We hope you can spend time with family and friends and take a well-deserved break from the market.
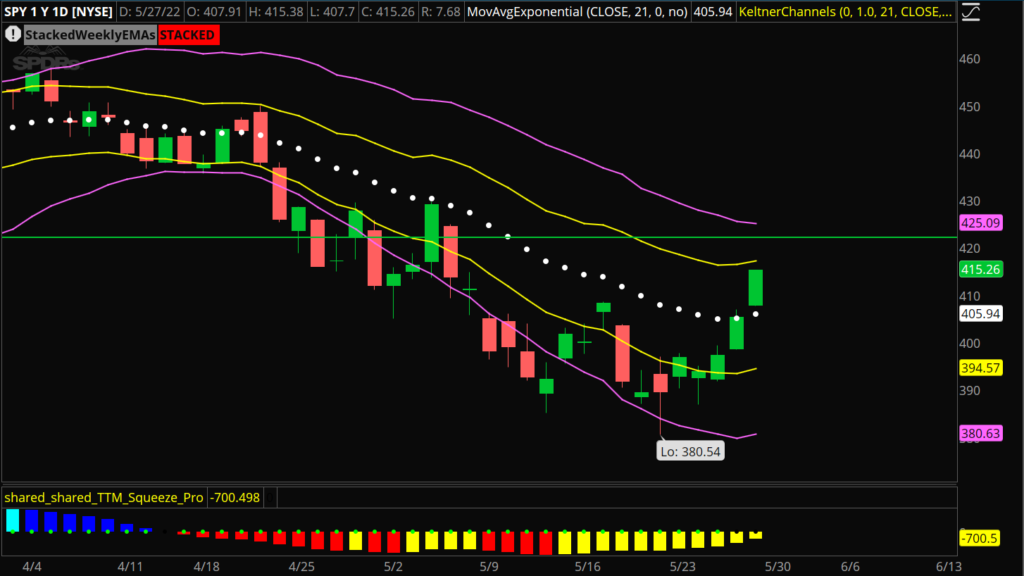
The S&P 500 closed above the daily 21 exponential moving average (EMA) on Friday for the first time since March. However, this doesn’t change the bigger picture that the path of least resistance seems to be to the downside.
That being said, we’ll look for bounces to be our next short opportunity.
In the video above, we’ll lay out how to play these ebbs and flows with short positions and review our SPY call debit spread.
For the last few weeks we’ve been discussing the potential of a short squeeze in the markets. That’s exactly what we saw on Thursday and Friday of the 3-day weekend.
Bear market bounces are fast, brutal, and can last longer than anyone who’s holding short positions would like to bear (no pun intended). The key, however, is to see these bounces for what they are. So long as the weekly structure remains bearish, these bounces can make for some of the best shorting opportunities in a downtrend.
SPY Daily Chart
Looking at the SPY, it looks like it could have cleared itself a path for a push into $420 next week with Friday’s close above the daily 21 exponential moving average (EMA). While our major focus will be shorting this bounce, remember that these reversion-to-the-mean moves can make for solid, albeit short-lived, long positions.
On Friday afternoon, we bought a 6/03 expiration call debit spread on the SPY in the Compounding Growth Mastery. Should we get the push into $420+, the trade should net a 200% to 300% return. We’ll look to parlay those profits into new shorts.
As for structuring shorts, we’ll be looking for initial entries in July expiration call credit spreads with a simple risk management plan. So long as the market is trading under the weekly 21 EMA, we’ll continue scaling into shorts looking for the next flush to new lows.
The overall market might be as bearish as it’s been in a while, but there continues to be great setups looking poised for more upside. XLE, USO, and XEL are just a few examples we’ll cover in this Sunday’s watchlist video!
Now that the market has digested the FOMC minutes and NVDA earnings, we’re ready to take on whatever the market brings next on Friday.
In this video, we’ll break down the S&P 500 (/ES) daily chart to show similar patterns over the last two days. This gives us more clarity and confidence moving forward.
We’ve seen the market hit a key level, flush below it, and make a strong recovery for a reversion to the mean. This is an important lesson of how price acts at large key levels.
After a big flush to $3,855, we saw /ES seek out liquidity in a cover pop type fashion. What we mean by liquidity is price working toward point of control (POC) and the daily mean (21 exponential moving average).
Regardless if we’re bullish or bearish, this is the area we want to step back, reanalyze, and prepare for what can happen next.
We’ll review the major indices and cover a few setups on our focused list on NVDA and SHOP.
After a choppy week of options expiration (OPEX) this week, a few catalysts are to note.
Federal Reserve Chairman Jerome Powell is giving welcoming remarks on Tuesday afternoon. This pre-recorded event will likely not be a significant market mover, but it is worth keeping an eye on.
More importantly, the Federal Open Market Committee (FOMC) minutes will be released on Wednesday. This is a chance for the algorithm to react to the minutes without having Powell speak afterward.
We’re focusing on two names recording earnings this week. Both NVDA and SNOW will report earnings on Wednesday night.
As for the overall market, we’re focusing on similar key zones.
As long as the S&P 500 (/ES) is above $3,855 (the low from two weeks ago), the market could work its way back toward liquidity. Point of control (POC) is near $4,013, and the daily mean (21 EMA) is above near $4,070.
If /ES breaks below $3,855, the market will become extremely vulnerable. We’ll look for it to drop to last week’s low at $3,807.50 and potentially hit $3,796 and $3,760.
In the video above, we’ll discuss the key zones on the major indexes and share charts with our favorite setups.
Here is our focused list:
NVDA — Be patient heading into earnings. See if it can work its way back to liquidity at POC near $174. We’ll look to trade NVDA off the low at $156.
SHOP — There are three main levels of liquidity that we are eyeing: the current POC at $360, a prior POC at $340, and another prior POC at $401. We’re planning on buying SHOP and playing it back up to the range from $383 to $400 before it potentially reverses.
ROKU — With any dips, look to play ROKU up to POC and the daily mean near $96. Above this, we’ll look for $103 to $106.
The S&P 500 (SPX) put in a new low at $3,810 and bounced into the close on Friday. Now the question becomes if we can get a bounce to the 21 exponential moving average (EMA).
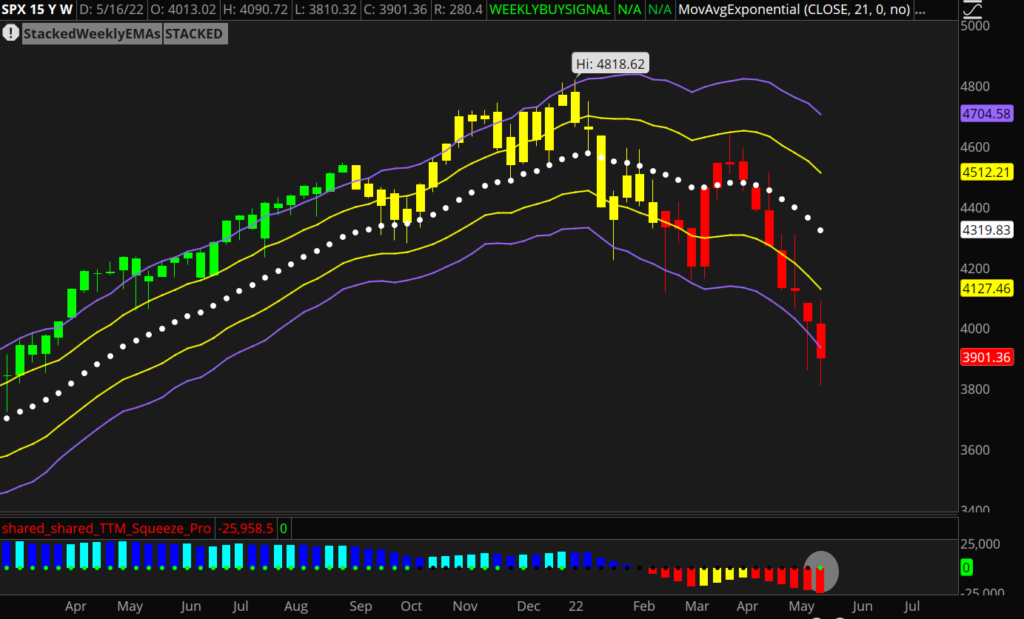
The SPX is trading below the weekly 21 EMA for the first time since COVID-19 started. This represents a large shift in trend and structure.
If we consider the bearish squeeze firing, we have even more reason to believe the path of least resistance could be to the downside.
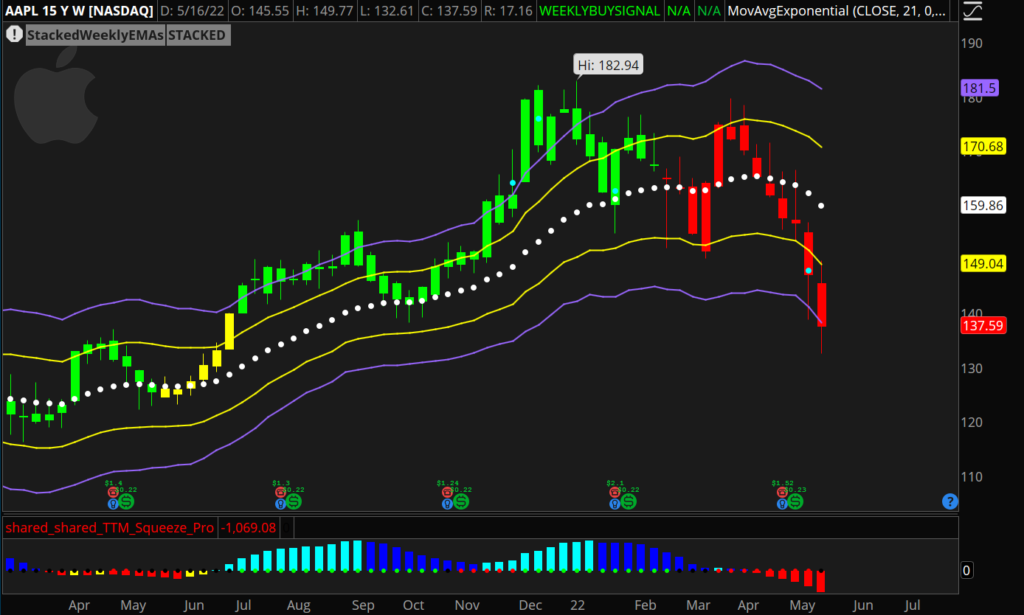
In the video above, we’ll lay out where we’d like to short SPX along with other setups on our focused list like AAPL, TXN, and more.
As of today’s close, many of the bearish weekly squeezes we discussed last week have officially fired short. This adds to the list of reasons we’re looking for a continuation lower.
Remember, the rule-of-thumb with a squeeze is once it fires, we’ll typically see 5 to 8+ weeks of momentum. Given these are weekly squeezes, there’s the potential for 5 to 8+ weeks of momentum to the downside. That’s momentum we want to ride.
SPX Weekly Chart
AAPL Weekly Chart
Two examples of big (and important) weekly squeezes firing short are SPX and AAPL, as shown above. We’d like to short both of these names on the next bounce. There are similar setups all over the place, but these are the two we’ve decided to focus on.
Keep in mind that it isn’t just the weekly charts setting up for further downside potential.
As of this week, we’re also starting to see monthly charts lose structure with moves well under the monthly 21 exponential moving average (EMA). This alone is a huge shift of trend and structure, all in favor of the bears.
As for how we’ll look to short any bounce, July expiration put debit spreads and call credit spreads will be our strategy of choice. As always, we’ll aim to work our desired risk: reward.
Stay tuned for the Sunday video, as we’ll price out a few trades together that we’re looking at.
It’s been a volatile and exciting trading week due to options expiration (OPEX).
This week’s price action captures what we can expect during OPEX and volatile times. The market has seen chops, pops, and a big drop.
After the S&P 500 (/ES) dropped near $3,855 on Wednesday, the question now is if we see another significant move on Friday.
For the market to pop, the /ES has to break through the $3,900 and $3,928 range. Then we could see a push to the $3,980 to $4,000 zone.
If the /ES rejects the zone from $3,900 to $3,928, we’ll look for the market to retest the low from last week at $3,855. Below this level, the market could fall to $3,843.
Remember the importance of liquidity and major zones. Trading zone to zone can be especially useful during a volatile OPEX week.
In the video above, we’ll review the price action and zones of the major indexes and the SHOP setup we’re keeping an eye on.
This week we are anticipating options expiration (OPEX) on Friday, May 20.
Big money likes to take advantage of options expiration to cause chop and keep price near liquidity. This week, keep this in mind to either stay out of trouble or take advantage of this event.
It’s important to be aware of OPEX as it ties in with trading around liquidity.
The point of control (POC) for the S&P 500 (/ES) dropped to $4,013.50. On Monday, /ES spent most of the day trading around this POC level.
On Tuesday, we have two catalysts that could impact the market. First, we’ll have a member from the Federal Reserve speak at 8:00 a.m. Eastern. At 8:30 a.m. Eastern, retail sales from April will be reported.
In the video above, we’ll lay out potential scenarios we could see this week with OPEX and lay out our next liquidity targets and key zones.
Here is our focused list:
SHOP — If SHOP pops and fails at $383, we’ll target $355 to POC at $340. If it pops and breaks through $383, we could see SHOP hit POC at $401 and reach the $430 to $440 range.
ROKU — As long as ROKU is below the $103 to $98 zone, look for a drop to $88.50 and $83. If ROKU holds $92, it could pop to the mean at $98.