Shortable Bounce?


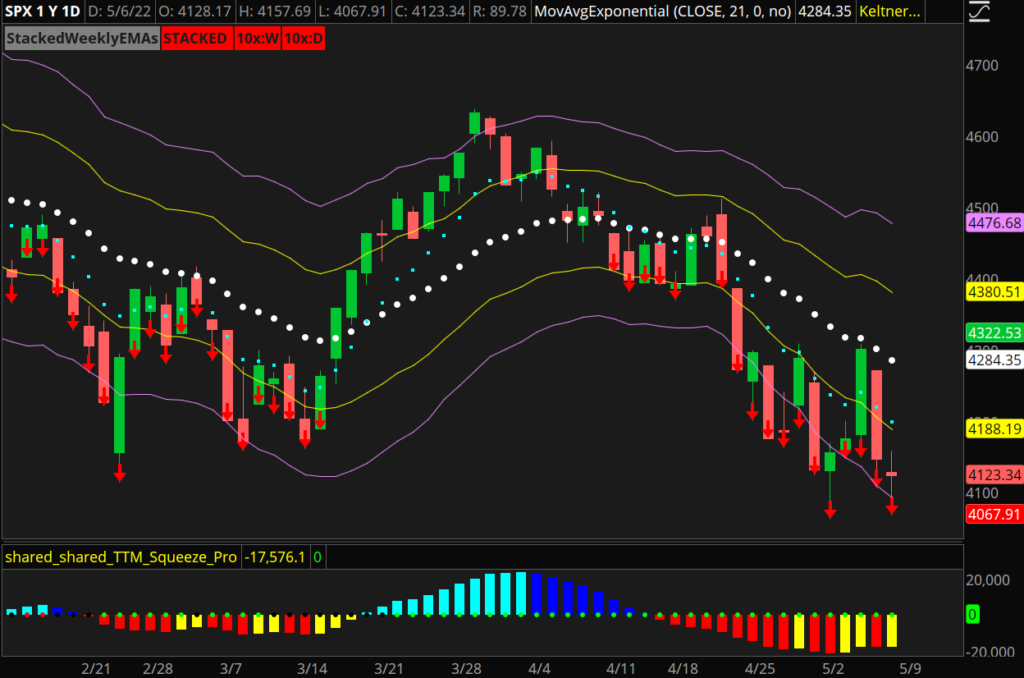
The big question heading into next week is whether or not we get a shortable bounce. The weekly and 3-day squeezes in the S&P 500 (SPX) continue to look poised for more downside, as they haven’t even fired short yet.

In terms of shorting the bounce, in hindsight, it would have been great to short the post-Fed pop on Wednesday. 

After Federal Reserve Chairman Jerome Powell wrapped up his speech, we saw the SPX, QQQ, and names like TSLA rally into their falling 21 exponential moving averages (EMA). We didn’t take any action into that pop (aside from taking profits on long positions), so we are patiently waiting for the next bounce before initiating our shorts.


SPX Daily Chart


Remember that heading into next week, we have the indices trading below -2 average true ranges (ATR) on the daily charts with a put/call ratio above 1. Often when the market finds itself in this position, there is a potential for a short squeeze around the corner.


As bearish as things look, we suggest being careful playing the short side until we see a brief relief rally. If we do, we’ll be ready to open shorts on the SPX as close to the 21 EMA as possible.

Stay Focused!


Free Falling into Friday


Our final catalyst for the week is the Nonfarm Payroll (NFP) job report on Friday morning before the market opens. This economic event is our chance to see what big money wants to do for the rest of the week, whether sending this market even lower or giving a relief pop.

We are in a bearish market, so we will continue to focus on shorting the pops. 

After the FOMC event on Wednesday, the S&P 500 (/ES) had a large cover pop to $4,300. On Thursday, the /ES broke through point of control (POC) and started to head toward the previous low of the year at $4,101.

In the video above, we’ll lay out key levels on /ES where we’ll look to enter our short positions. We’ll discuss the rest of the major indexes, volatility, and our SHOP setup after a disappointing earnings report dropped it lower than the expected move.

Stay Focused!


Big Drop, Cover Pop, Bring on Fed


This week, our main focus is on the technical levels in play on the major indexes and the catalysts that could affect the market. 

The S&P 500 (/ES) fell to the previous low of the year on Monday at $4,101.75. It quickly made up for the drop with a pop back to a key zone. 

In the video above, we’ll review the major price action on Monday and lay out the next key zones to focus on.

The first catalyst we’re keeping an eye on is the economic calendar.

On Wednesday morning, we’ll review the ADP Employment report and see if that impacts price action. 

The Federal Open Market Committee (FOMC) statement will be released at 2:00 p.m. Eastern time on Wednesday. Federal Reserve Chairman Jerome Powell will speak immediately after. This is our largest event this week that we will tie into our overall thesis.

The next economic event we’re focusing on is the Nonfarm payrolls (NFP) job report released on Friday morning.

Our main focus will remain on the major indexes at the beginning of the week. 


There are names on our focused list we are anticipating earnings reports. We’ll look to play these names later this week.

After market close on Tuesday, AMD reports earnings. See if the news offers setups on itself or other names in the semiconductor sector, such as NVDA.

On Thursday morning, SHOP will report earnings. We’ll look to play the news on Thursday and Friday live in the Simpler Day Trading room.

Until then, ignore these stocks, be ready for the earnings reports, and stay up-to-date on the economic data.

Stay Focused!


‘Easiest’ Short, Bearish Structure


Heading into the week ahead, our major focus is on shorting the bounce. 

Our sell signals are printing across most of the market. Our bearish watchlist includes names like the S&P 500, Nasdaq (QQQ), semiconductors, financials, industrials, transports, etc.


When there is bearish structure across most of the market, the easiest short position usually tends to be on the SPY or SPX.

In this video, we’ll break down the SPX short setup we’re focusing on, review sectors on our bearish focused list, and discuss the few bullish names setting up.

Stay Focused!


Big Bust, Big Tech Earnings


Technology giants reported earnings this week. They failed to do the market any favors in shifting the current bearish structure. 

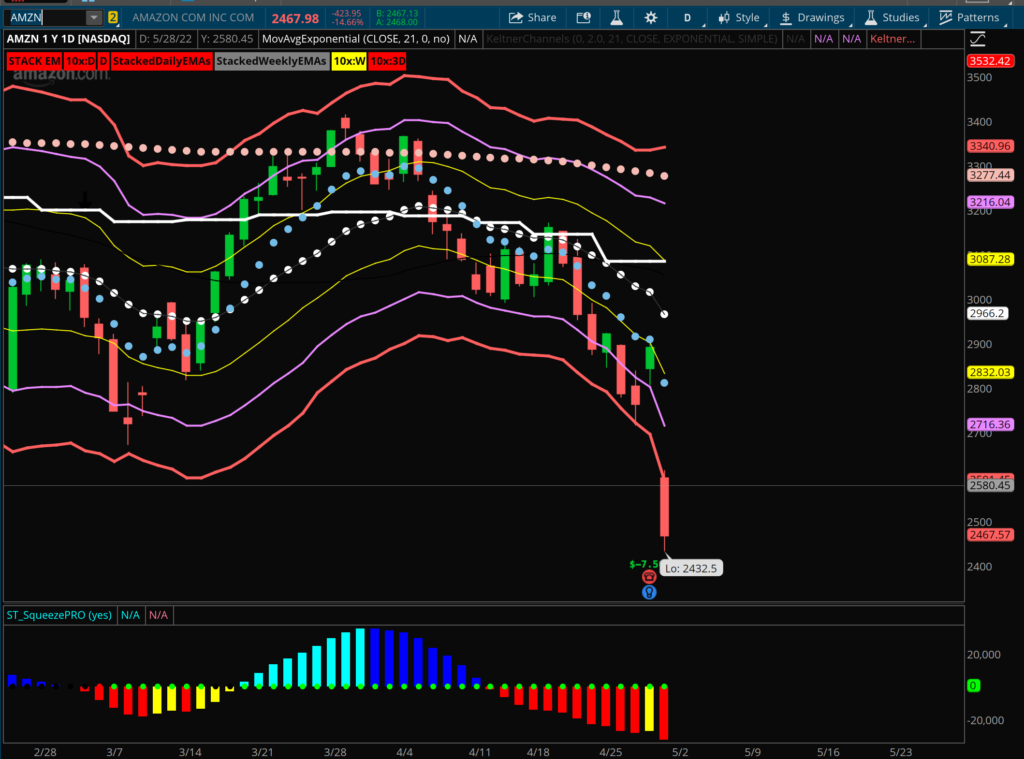
AMZN saw a 10 percent gap lower at the open (as shown below). This drop set the tone for another day of steady selling pressure through much of the market.


AMZN Daily Chart


After running the scans and updating our watchlist on Friday post-close, it’s safe to say the short side of the market is likely to present the most opportunity. 

However, it’s hard to want to heavily short the markets as they are oversold and due for a bounce. Preferably at -2 average true ranges (ATR), we are taking profits on our shorts and not opening new shorts.

So, where do we want to short the setups on our watchlist? 

We want to enter our positions as close to the daily 21 exponential moving average (EMA) as possible. 

That’s the execution on every short we take. Short at the 21 EMA, take profits on the flush into -2 ATR (or cut the trade loose on a move above our exit), and rinse and repeat.

Almost every sector in the market, along with the indices, is printing our sell signals. These sectors include XLK, XLF, SMH, XLI, IYT, etc. 

When this happens, we tend to focus mainly on shorting the SPX itself instead of individual stocks.

It’s a simple game plan, but it’s one we’ll continue putting to work until things change. 

For the S&P 500 (SPX), we’ll look for our opportunity to enter a short on any rally into $4,350 with a downside target of $4,100.

In Sunday’s video, we’ll break down how we’ll look to structure the SPX trade and look at other setups on our focused list. 

Stay Focused!

Tech Earnings Zones


After a week of big technology earnings, the market is taking a much-needed pop. The move higher comes after hitting the low of the year at $4,101.75.

Focus on structure and key zones. The same levels we’ve seen recently are in play.


Heading into tomorrow, if the S&P 500 (/ES) breaks $4,260 and begins to trend lower, we’ll want to start focusing on the key zone toward $4,181. If the /ES holds $4,260, it would need to get through the key zone at $4,360 to bounce higher.

In this video, we’ll lay out key zones in the market and lay out setups on our focused list like AMZN, AAPL, and ROKU.

Stay Focused!


Look for Leaders in Trends


Sell signals are flashing across the board from the S&P 500 to the financials and semiconductors. The key is to ensure we’re not chasing the market. 

Instead, we want to focus on the cleanest trends setting up near the 21 exponential moving average (EMA).

In today’s video, we’ll cover bullish names on our watchlist that we’ll look to buy the dip at the 21 EMA.

For the most part, we’ll review our bearish watchlist of names breaking structure on both the weekly and daily charts. These are the spots we’ll look to short on any bounces to the 21 EMA.

Register for free here to sign up for Taylor’s free webinar this Wednesday, April 27th at 7:00 p.m. Central. We’ll discuss the changes in the recent market, the leaders in the better-looking trends, and how Taylor builds out his watchlist based on his buy and sell signals.

Stay Focused!


Some Longs, Some Shorts


While most names in the market appear bearish, we need to make sure we pick our spots wisely on the short side.

The S&P 500 (/ES) and Nasdaq (/NQ) are trading at -2 average true ranges (ATR) from the 21 exponential moving average (EMA). We’ll look to short the indexes on a bounce to the 21 EMA.

In the video above, we’ll review our weekly watchlist, recently closed and open positions, and the bullish sectors in an overall bearish market.

Stay Focused!


Ready to Short Bounce?


This week the overall market continued to trade lower as the structure for most of the market continues to look more bearish. While there are still trends we are pursuing to the upside, like energy, oil, and consumer staples, there are plenty of setups we’re eyeing for shorts.

While we will look to short individual stocks (like we did this week in DASH, NKE, and FDX), looking to short in the indexes is often the “simplest” option. With that being said, we’re going to need to see a bounce in SPY and QQQ before entering a short.

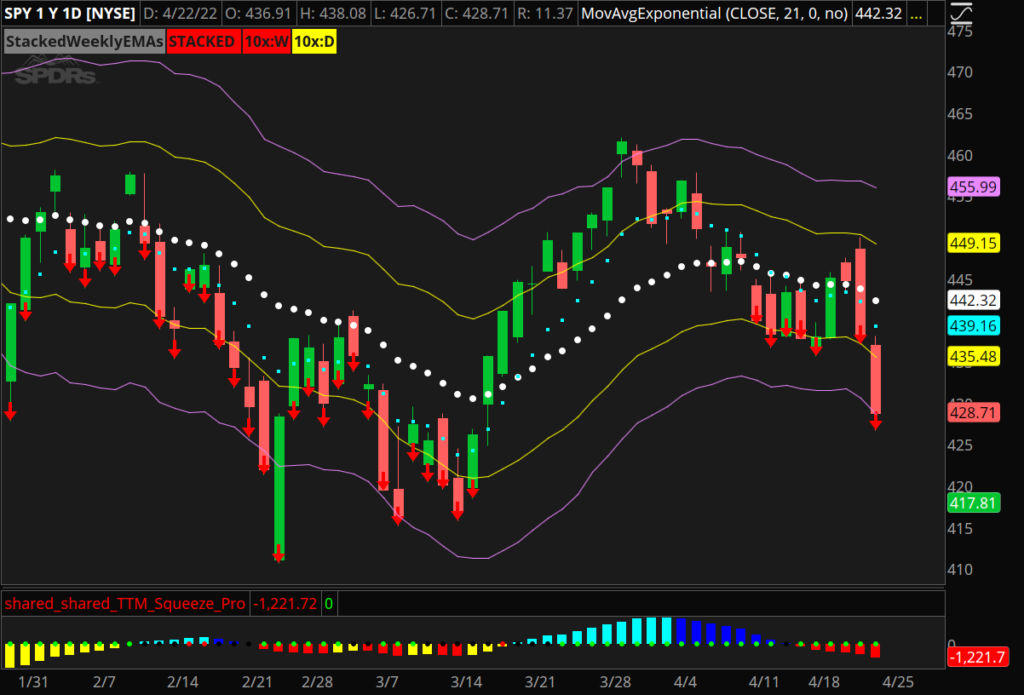
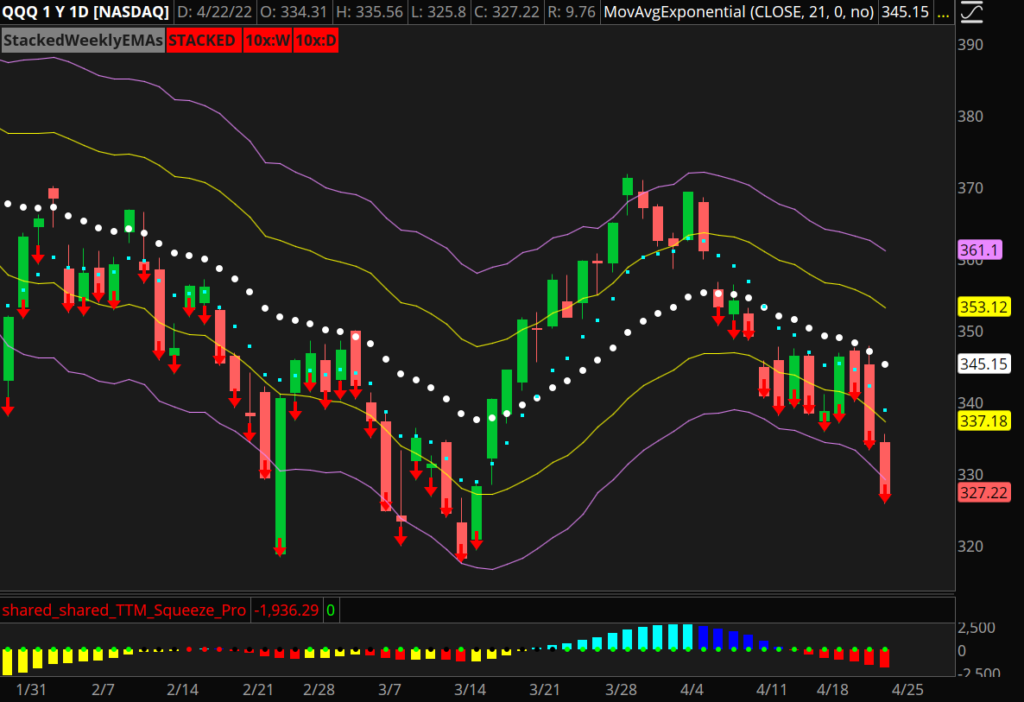
We use Keltner channels, measuring +1 and +2 average true ranges (ATR) above the 21 exponential moving average (EMA), as our upside and downside targets for swing trades. 

The SPY and QQQ are currently trading at -2 ATR on the daily chart, as shown below. This is the spot where we’d look to take profits instead of opening a new short position. When trading at the 2 ATR extension, there’s a growing probability of a move back to the 21 EMA around the corner. Getting short at -2 ATR and sitting through a bounce to the 21 EMA is no fun.


SPY Daily Chart


QQQ Daily Chart


Over the next few weeks, we’ll be waiting for a move into the 21 EMA to open shorts on the SPY or QQQ, with downside targets of -2 ATR.


Remember that we’re once again in earnings season, so there’s always the potential that earnings from big FANG stocks could shake things up.

In Sunday’s video, we’ll cover more of the bullish and bearish setups we’ll be looking to trade next week in both the Simpler Trading Options Gold room and the Compounding Growth Mastery.

Stay Focused!


Power of Daily Prep


Preparation Process

Prepping for the trading session is vital for becoming a successful trader and should become a daily, systematic practice. The goal of prep is to identify stocks with the best setups and opportunities. Once we identify these stocks, we can ignore everything else for the trading session. 


Day Trading Prep – by Chandler Horton

For day trading, I recommend only watching a handful of stocks and getting to know how they move and the risk vs. reward they offer. Every stock can present opportunities, so find your favorites and ignore all else for the most part.

Don’t underestimate the power of focus. The trader who chases too many stocks capitalizes on none. You will never catch every move, so make sure you have a reason to be watching a stock!

New names come and go, but make sure you hit the best trades on your focus list! My “ole reliables” are SPX, GOOGL, ROKU, MRNA, and NVDA. Every session, these names offer opportunities, so there’s no need to look much further!

Always start with the big picture for a stock. Understand that not every stock is in a playable range. This is why we have a focus list. As you go through each name, you will find which stock is in a tradable range that offers the best edge! Keep in mind some names need time to set up.

We like to narrow down names near big inflection points and key indicators. This is where strategy is a benefit.

Some stocks have already made big moves and need a pullback.

Some stocks are setting up and about to begin week-long moves.


Swing Trading Prep – by Taylor Horton

When I first started trading options, I wasn’t using a scanner. Now it is a part of my daily prep process. Before, I would stay up all night searching through charts that had what I believed was a decent setup. Decent doesn’t cut it.

We have this built-in mindset to grind and look for setups all night. In reality, what we want to look for is efficiency. Using a tool to sift through charts for the best setups eliminates emotions and saves time.
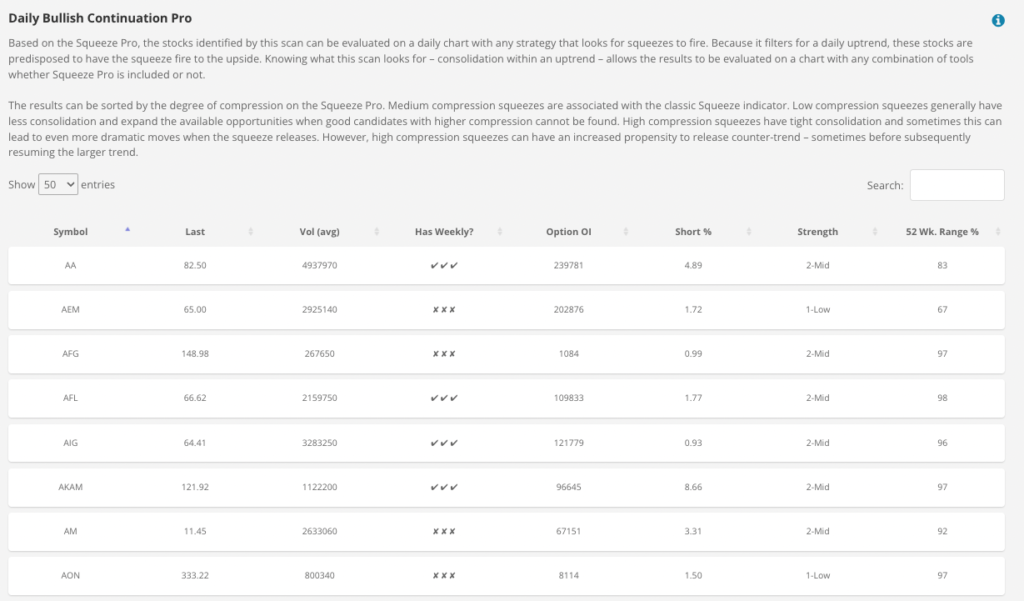


Above is a list of the scan results from the Simpler Trading scanner. This is your starting point.

70% of the time, I use results from the Focused Scans. 

These are scans designed for my strategy. We have four scans under our Focused Scans: the Bullish Daily Continuation Pro, Bearish Daily Continuation Pro, 3-Day Daily Bullish Continuation Pro, and 3-Day Daily Bearish Continuation Pro.

The rest of the time, I use results from scans like the Growth 250, 10x scans, Daily Pop Candidate, and others included in the Scanner.

I prefer to trade mid to large-cap (capitalization) stocks. To focus on those stocks, I like to sort by Volume (average), with names with the most volume at the top (as shown below).
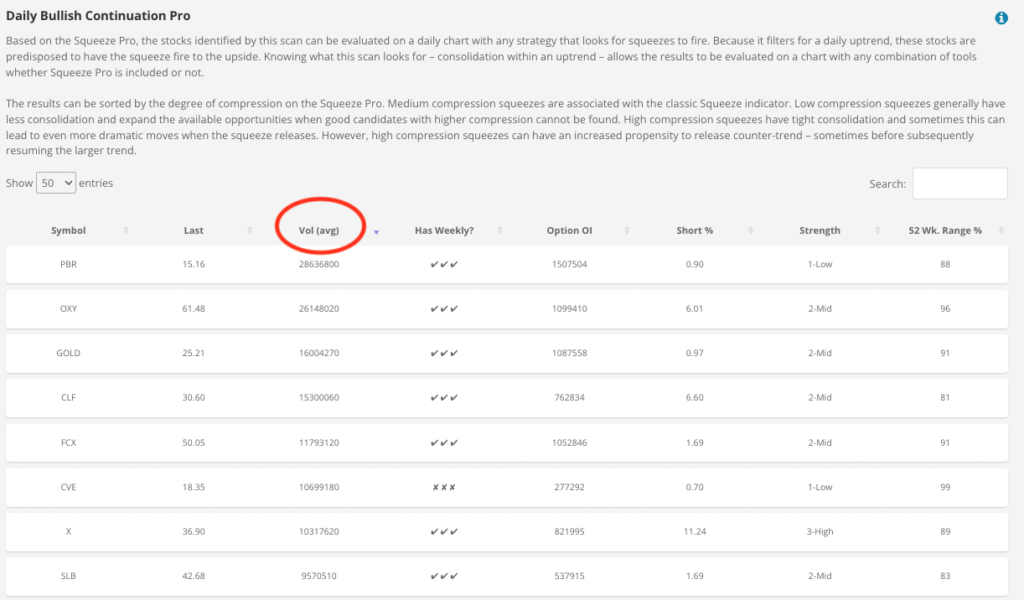


When there is more volume, the stock is larger. It has more momentum, and more importantly for an options trader, there is higher liquidity.

I like to show about 50 entries. You can choose to have 10, 25, 50, or 100 entries showing in a list at once. That’s 100 stocks you can automatically sift through in just seconds.

After I run the scans, I will look at each scan’s top 25 to 50 results. The next step in our prep process is running the names through our checklist criteria. This is when we determine which setups “fit the bill” and have actionable opportunities.

This is when you need to have discipline and a trading plan. Remember, the setups that don’t meet every one of our criteria get ignored entirely because they are none of our business.


Taylor’s Focused List

Here is a list of my focused list for Friday, April 22, 2022:

  • CCJ
  • OXY
  • XLE
  • KR
  • COST
  • IYT
  • XLF


Prep with Us

Our job as traders is to know when and why to trade each name! Tune in to the Focused Trades Youtube Channel every Monday, Wednesday, and Friday for live premarket prep with us.

Take your prep to the next level and check out Chandler’s Options Scalping Secrets course here. I explain my strategy for identifying inflection points using simple indicators to catch big scalping moves daily.

Stay Focused!