
AAPL Call Trade: Two Shots At $350 Into FOMC

SPX and QQQ gapped lower this morning, and the question I put to the room before the open was whether they survive it. Monday was all about QQQ and SMH names, with a handful of banks improving, and the Scorecard rankings had just flipped negative, which I covered in Tuesday’s QQQ Scorecard rankings breakdown. A gap lower is a real test of that bounce. I used the open to finish one trade and start another. Let’s take a deeper look at the AAPL call trade:

$350 Capped My First AAPL Call Trade

Last week I was long AAPL through a call debit spread, which I laid out in my Apple squeeze trade breakdown. On Friday morning, October 23, it popped into $350. I booked the gains on the spread at $3.20 and told the room it could keep going, or $350 could end up being resistance.

By that afternoon, $350 had proved to be resistance. I was out at the right spot, with nothing to do swing wise into the weekend, so I hung tight with my open trades and waited to see what Monday brought.

Why I Sized the AAPL Call Trade Small Into FOMC

On Tuesday morning, October 27, AAPL was setting up nicely again, so I went back in. This time it was the Friday, October 30 $350 calls at $2.22, the same $350 level that capped the first trade.

With FOMC coming, I told the room to size this one small enough to accept the max loss, and to play with some of last week’s profits if possible. A call that expires Friday can go to zero on a bad reaction to the Fed, and the size has to be able to take that before the trade does anything.

Wednesday, October 28 was quiet. AAPL did not do much through the session, so I held the position into the close and let the setup work.

AAPL, 30 min Chart 10.29.26
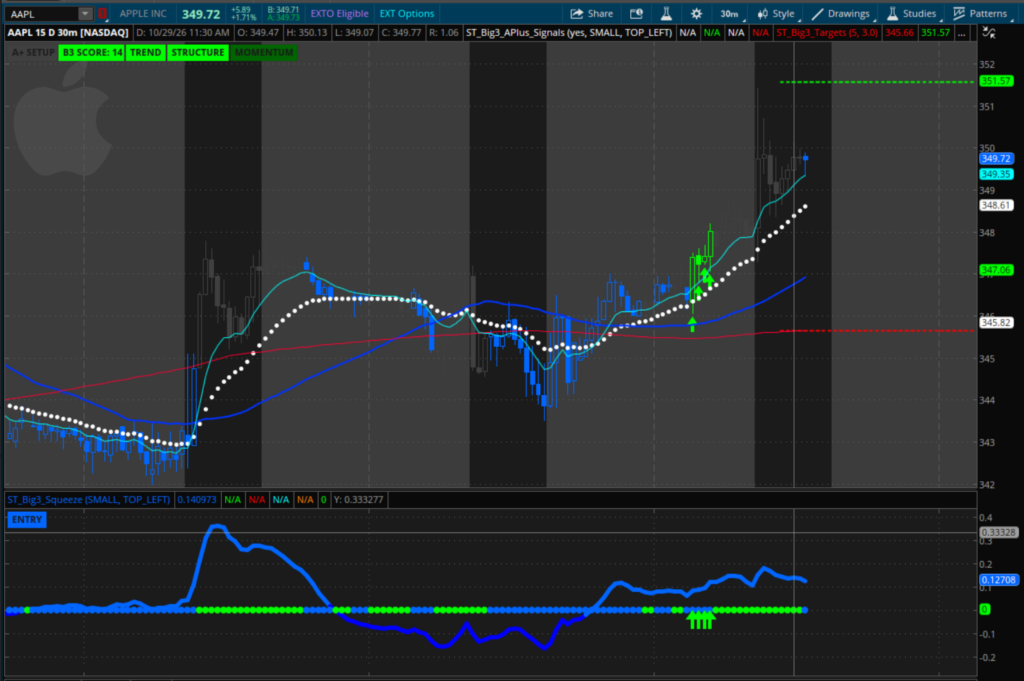
AAPL call trade entry exit around the $350 level

Taking the Exit at the Open

This morning I sold the $350 calls at $2.46 at 8:33 a.m. CT, three minutes after the open, for a 10.8% gain on the AAPL call trade.

The exit came on a morning when futures had gapped lower, with the calls one day from expiration. The trade was sized for the worst case going in, and it closed green two days later.

An SPX Put Credit Spread Into the Gap Lower

With AAPL off the board, I turned to SPX. At 9:01 a.m. CT, I sold the same day 7705/7695 put credit spread for $3.10.

The $7700 area was the level I flagged on Monday and Tuesday. It held as resistance on Monday, then held as support on Tuesday morning, with resistance around $7710 overhead. I called that a $10 box and did not see much to do inside it. A break above $7710 could lead to a nice squeeze up, and a break below $7700 could see things begin to fade.

The spread is 10 points wide, so $3.10 in credit puts the max risk at $6.90 per spread. That is a defined number, known before the order goes in, which is the same rule I used on the AAPL call trade.

Two minutes after the fill, I had a working exit order in at $1.50. It filled at 10:30 a.m. CT. Profit target hit, with $1.60 of the $3.10 credit kept, or 52%, in about 90 minutes.

SPX, 15 min Chart 10.29.26
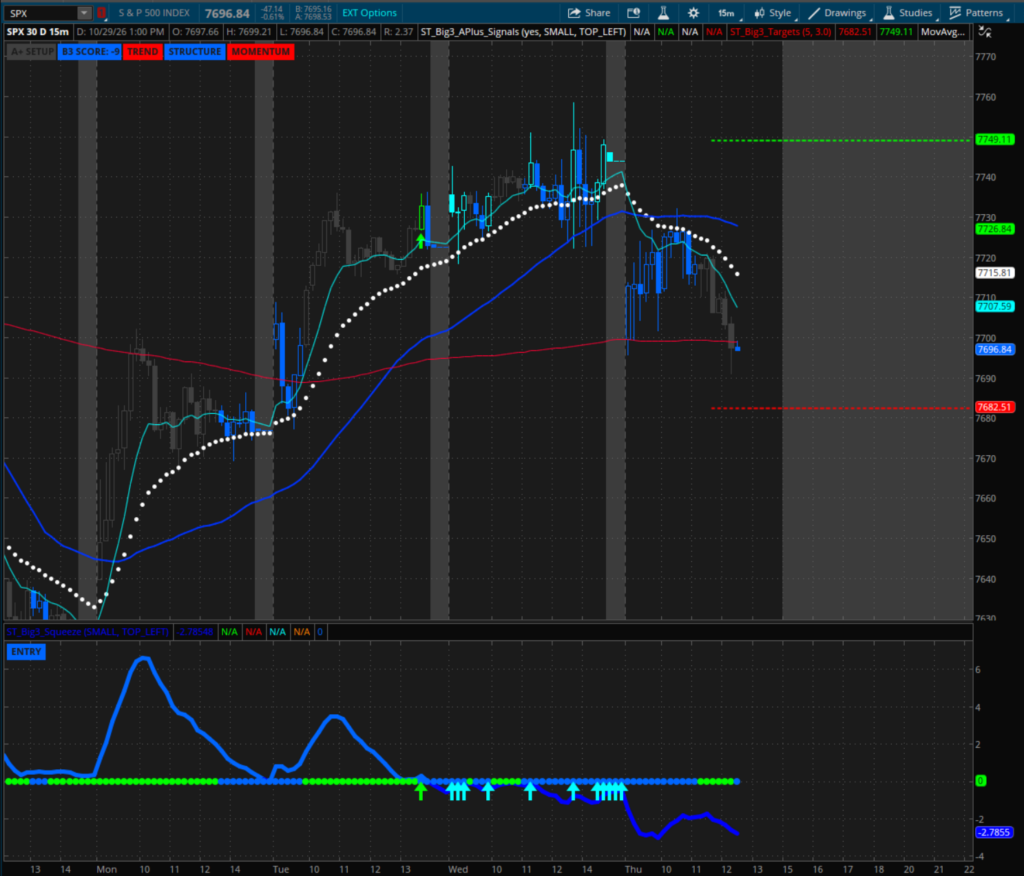
SPX put credit spread taken the same morning as the AAPL call trade exit

I told the room I was looking for a few more of these through the afternoon, and that would depend on how things unfold.

Where the AAPL Call Trade Leaves Me Now

I am flat AAPL after two trades at the $350 level. If it sets up again, I will look at it again, with the same sizing rule.

I am still holding my NVDA December $200 calls. As of Monday, I thought it was too early to add, and nothing has changed that yet.

Both trades went out live in the Compounding Growth Rooms, posted as they happened.

Size every trade so the max loss is a number you can accept before you enter.

Stay Focused,

Taylor Horton

John Carter is now handing a big part of his trading process to AI. Watch the replay to see how he builds his own custom AI trading team, and why he says traders have an 18-month window before the early adopter edge is gone.
QQQ Scorecard Rankings Flip Negative Again

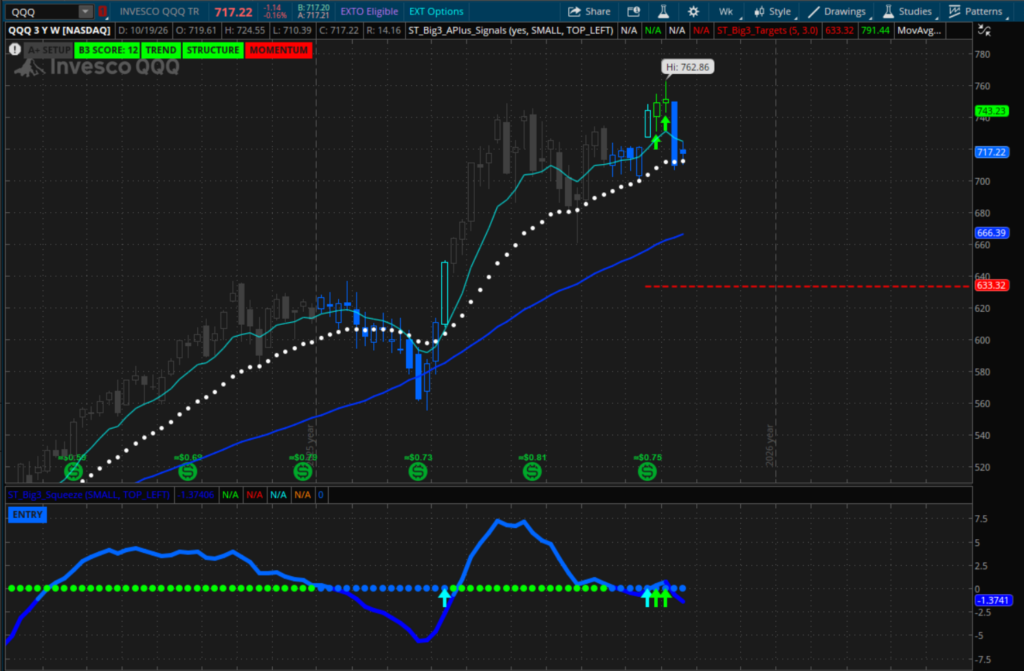
It’s a busy week my friends. Earnings and the Fed land this week. Meanwhile, QQQ and chip names like Nvidia and Micron are bouncing off the low. I still want to be careful with QQQ here, because it sits under a falling 21 EMA with a negative MACD line. Something else stood out to me this week, and it is worth a closer look. Let’s take a deeper look at the QQQ Scorecard rankings:

The full chart walkthrough is in the video below.

The 21 EMA Is the Over/Under Level Into the Fed

Back in mid-September, QQQ had the structure you want: the 21 EMA above the 50, both trending higher, and a bullish MACD line. That kind of tape lets you buy the pullback to the 21, watch it hold, and ride the next push higher.

That is not what we have now. Price is under a falling 21 EMA and the MACD line is negative. That opens the door to a flush, a rally back toward the 21, and a rejection back down. The Fed could drive that move, and so could earnings.

Either way, I think the 21 EMA is a pretty big over/under level toward the end of the week. It is the same backdrop I covered last week when I explained why I am long Apple, the strongest name on the board.

The Big 3 Squeeze Checklist Is Not Bad, Just Not Ready

On the Big 3 Squeeze update, the picture is not perfect and not bad. Structure and trend are still good, and QQQ scores 12 out of 15 points on the checklist.

The problem is the negative MACD turn. There is no shorter-term buy trigger behind it yet, and that trigger would be the beginning of the path back to a buy signal. If QQQ can hold the 21 EMA, things should get a little more stable from here.

Where the QQQ Scorecard Rankings Stand Now

Right now the market reads neutral, and QQQ sits at a whopping 17% of its strongest score. Call it neutral with a very minor hint of bullish.

I pulled up a chart of the QQQ Scorecard rankings going back to May. Each daily reading comes from the Big 3 Scorecard, a 15-point checklist across eight different timeframes. A reading of 100% is the most bullish case, and negative 100% is the most bearish.

If you watch my videos or sit in my room, you hear me bring up the April and May market a lot. Better direction, more clarity, frankly an easier market. In May, QQQ averaged 85% of its strongest score. With that kind of QQQ behind you, the breakout, the pullback, the day trade and the swing trade all get easier.

Why Negative QQQ Scorecard Rankings Have Marked Bottoms

Here is the observation. Going back to May, the QQQ Scorecard rankings have shifted negative only three times, and we are in the third one now. The weakest reading came near the end of July at negative 37%.

That late July shift is the moment everything got a little more bearish, and on the QQQ chart it marked the bottom. A big move up into August followed.

September played out the same way. QQQ had a flush, a little break below a key level, and a breakdown attempt. Then it turned the corner. The rankings went back to the buy side, 55%, 60%, 70%, 80%, and got as high as 98% of the strongest score in September.

So far, a negative ranking has not led to a bigger breakdown. It has been more of the opposite: rankings go negative, everybody calls for the end of QQQ, and back up she goes. To be clear, the Fed and earnings can change everything this week. This is an observation, a conversation amongst friends, not a forecast.

What the QQQ Scorecard Rankings Need to Turn Positive

The rankings are trying to turn back to positive, and the price action is where I check that. Into the Fed, I want QQQ to hold above its short-term 21 EMA. It is trying to rebuild momentum to the buy side and pull that 21 back up.

In most cases, if QQQ keeps the MACD line above zero and pulls the 21 EMA back above the 50, it has better momentum and better structure to work with. A couple of folks got short on the breakdown, and at a minimum I think we could get back up toward $730, maybe $735, by the end of the week.

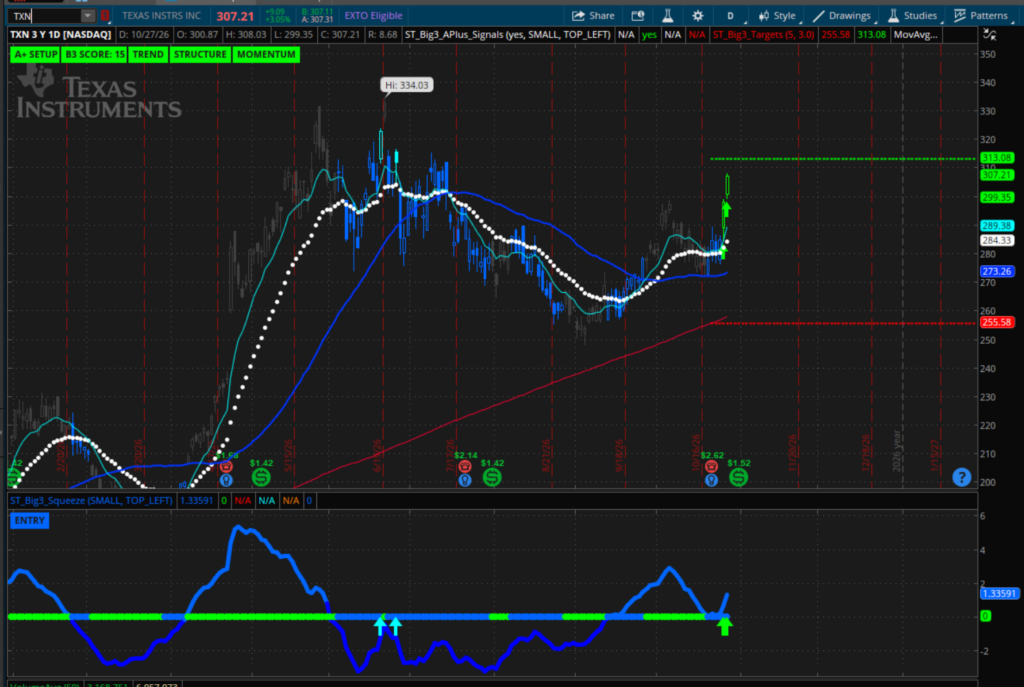
TXN Has the Squeeze, and the Trigger Still Matters

I do not have too many new ideas this week, and I will have more for you at the end of the week. One name I would put on your watchlist is TXN.

It has a beautiful squeeze. I am a little late to that party, so what I want now is for the MACD to finally get back above the zero line and stay there. That would give us a buy trigger, and that could be good for a move back to at least the previous highs. I am also still watching Micron. We are way too early to buy that one, and I will keep updating you on it.

Daily Chart, $TXN 10.27.2026

TXN squeeze chart with the MACD working back toward the zero line, from the QQQ Scorecard rankings breakdown

TSLA Could Be Setting Up the Henry Gambell Special

Tesla had a killer week, pushing through $400 into $405. With Tesla being Tesla, the next target could be the big $420.

What I would look for is what I call the Henry Gambell special. Find the end-of-day squeeze, then use that compression to buy an out-of-the-money call, an out-of-the-money call butterfly or a call debit spread, keeping your size in check. Ideally, like you had today, they gap it up the next session and the squeeze fires in your favor right out of the gate.

I will update you at the end of the week. Until QQQ holds above its 21 EMA, I am staying patient.

Stay Focused,

Taylor Horton

I run one process every day, and John Carter is handing a big part of his to AI. Join him live Wednesday, October 28 at 6 PM CT to see how he is building his AI trading team. Save your seat. 

Apple Squeeze Trade: My Plan Into Earnings


I spent most of this week down with the flu, and the market did not wait for me. QQQ failed its breakout and is back trading around $700 to $705, right where it came from. The structure still favors the bulls, with the squeeze intact and a compression pattern that has not broken. The problem is the short term, where short triggers now sit on every timeframe but one. One name is doing the exact opposite, and it is the best setup I see on the board right now. Let’s take a deeper look at the Apple squeeze trade:

The Bull Trap Is In Place On QQQ

We got the MACD shift and we got the buy trigger. Then the breakout failed. You never love to see that, and a few bulls who bought the breakout attempt are now stuck in a bull trap.

The bears have control of every timeframe but one. If price cannot get back above the 21 EMA, there is room in the short term for a flush down to the 200 SMA around $685. That is not a great combo to go for the breakout.

For now, I am keeping the December QQQ calls. If QQQ gets back above the 21 EMA with a short-term buy trigger, I will take a little nibble on more of the $700 calls.

On Tuesday, I laid out the QQQ buy signals I needed before putting cash to work. That line has not changed.

Three Losing Trades I Would Take Again

We had a few losing trades over the last 10 to 12 days, and the theme across all of them was failed breakouts.

NBIS came first. I jumped in on the squeeze buy trigger on October 6th, looking for a move into at least $275 to $280. NBIS had other things in mind. It put in an ugly failed breakout, and I dumped it on October 8th on the break below the 21 EMA. It’s never the result you want when you open a trade, though I kept the risk in check and took it off for a small loss.

DELL was next. I bought it on a squeeze and took it off for a loss on the 14th. SNOW was the third. I bought it on the trigger on the 13th and took it off two days later on the 15th.

After every losing trade, I ask myself one question. Putting the result aside, based on the indicator, the structure and the chart pattern, and following my system, would I take the trade again? If the answer is yes, it is just one of those trades that did not work. Out of every hundred trades I take, 25 to 35 are going to be like that.

Why The Apple Squeeze Trade Ranks First On The Scorecard

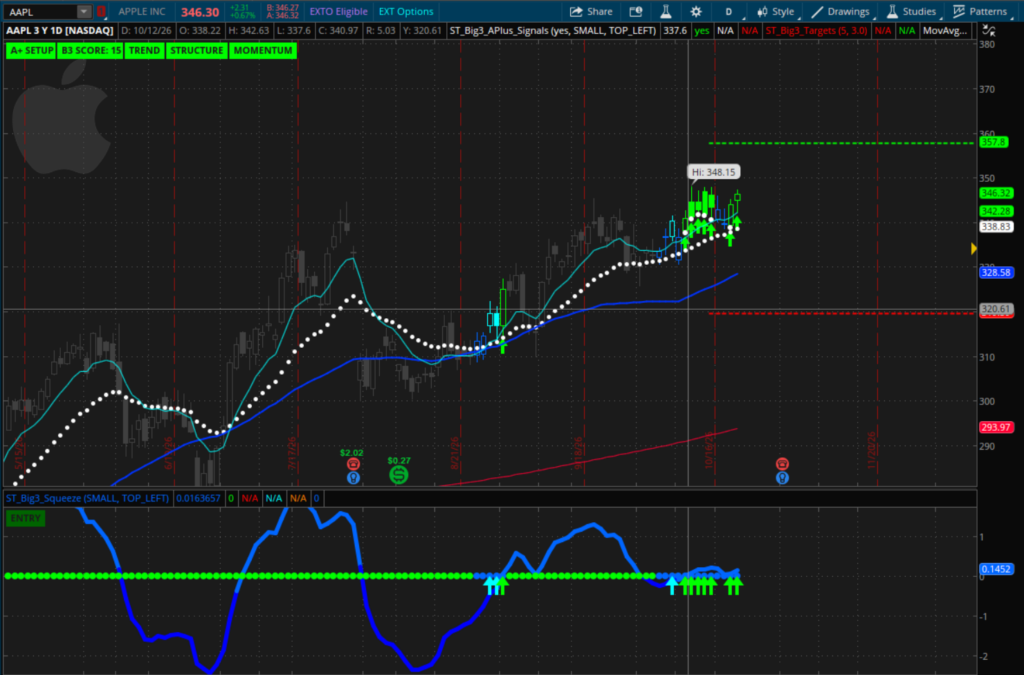
Apple looks amazing. It has a buy trigger on every timeframe, and a squeeze forming across six timeframes at once.

Apple Daily Chart, 10.22.2026

Apple squeeze trade chart with buy triggers across timeframes

Overall, we are at market neutral, and it is a weird picture. The RSP is very bullish, the S&Ps are neutral and QQQ is a bit weaker. The good is coming from XLP, healthcare, financials, biotech and energy.

In the Big 10 basket, only two names sit at the 50% bullish threshold or better: Apple at 100 and Tesla at 50. Tesla could be a trade down the road. In the short term, Apple is numero uno.

Apple can also feed off a weaker QQQ. They are dumping Google, Microsoft, Meta and Nvidia, and for whatever reason Apple seems to enjoy all of that. Strongest name on the board, with a multi-timeframe Big 3 Squeeze and buy triggers to match. Until things change, that is the setup I like best.

How I Am Playing The Apple Squeeze Trade Into Earnings

We are long an out-of-the-money call debit spread for next week’s expiration in my room. The construction on the Apple squeeze trade is simple: defined risk on the strongest name I have.

In a normal market, you jump in here and look for a move into $355. We are not in a normal market, and Apple has earnings in a couple of weeks. So the play could just be for a move back into $350.

If the move into $350 pays, I book the profit. Then I take about a quarter of it and open something cheaper, a call butterfly or a call debit spread out of the money, to keep some skin in the game into the report. The exit plan on the Apple squeeze trade is set before price ever gets there.

Nvidia Is Still Compressing

I am also keeping the Nvidia calls. NVDA looks a lot like QQQ: a failed breakout and a pullback into the range.

Is it the picture-perfect squeeze poised to break out tomorrow? No. In a much better market, it would be 15 out of 15. I still want to give the trade more time to work, and with patience, I will look for more spots to buy pullbacks in good structure.

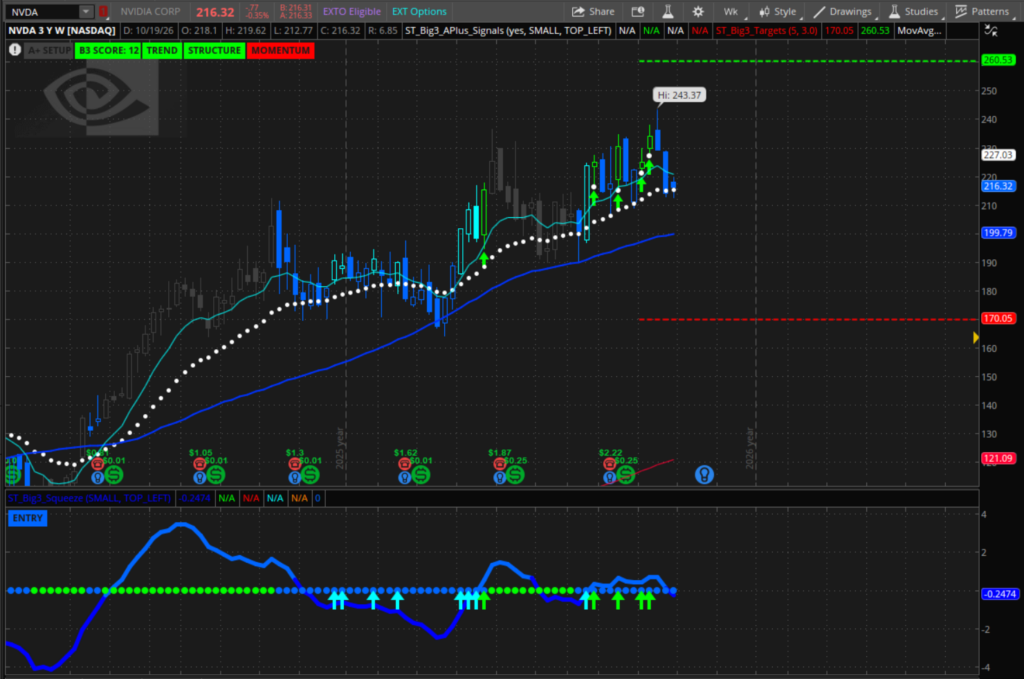
This compression has been going on since August, and we are now 15 to about 20 weeks in. One thing I know from experience: when that fires, long or short, it does not usually end in a tiny move. My preference is the one that takes it into $260.

The full chart walk-through is in the video above. Until QQQ gets back above the 21 EMA with a trigger behind it, I am not adding new longs anywhere else.

Stay Focused,

Taylor Horton

Jon McKeever put his method to the test with his own money on the line. Catch the replay to see how supply and demand, PMZ and Tr3ndy Precision work together before his 10-day challenge. Catch the replay here. 

I Am Putting Cash To Work If QQQ Does This

Tech bounced to start the week, but the story has not changed. The larger timeframes still carry weekly squeezes on key names, while the 15 minute through hourly charts have flipped bearish on most of them. QQQ remains below key daily levels, so I am holding off on new longs and practicing patience before I deploy more cash in a meaningful way. Let’s take a deeper look at the QQQ buy signals I need to see first:

No New Swings Until The QQQ Buy Signals Return

Last Thursday, QQQ flushed directly into the weekly 21 EMA and caught a big bounce off that level. Monday brought another solid bounce in key names. Neither one came with a meaningful buy signal, so neither one changes my plan.

For open positions, I am hanging tight and sticking to the game plan. For new swings, and for adding to the ones I already hold, QQQ has a lot of work to do first. Until then, any new trade I put on is most likely a day trade.

Last Week’s Lows Are The Line

The level that matters most right now is last week’s low on QQQ. It is very important that price holds above it.

Above that level, the bulls can rebuild above the weekly 21 EMA. Rebuilding means working back to QQQ buy signals on the 15 minute through hourly timeframes. Below that level, things could unwind lower in the short term.

QQQ, Weekly Chart 10.20.26

QQQ buy signals on the weekly chart with last week’s low and the 21 EMA

As long as last week’s low holds, the bulls have a fighting chance.

Where The QQQ Buy Signals Stand Now

Tuesday gave me the first crack. The hourly MACD on QQQ flipped to the buy side for the first time in two weeks. That tells me there is a good chance, for now, that tech grinds higher into the end of this week or early next week.

One hourly flip is not the full set of QQQ buy signals I am waiting on. The 15 minute and 30 minute charts still have to line up, and price still has to clear key daily levels.

In the meantime, I am scanning for end of day squeezes on the 15 minute and 30 minute charts as a few cheap bets into the next session. Those are short-term trades, not new swings.

The Squeeze Setups Waiting On QQQ Buy Signals

This is why patience matters. The bench of setups is strong, and almost all of it needs a better QQQ behind it. Every one of these comes back to the Big 3 Squeeze, and every one of them is waiting on the same thing.

GOOGL could be a big one, mainly on the weekly squeeze. I think it is too early to get aggressive here, so I am looking for quick trades on lower timeframes while I wait for the eventual big play on the weekly.

AMZN is the one to start watching closely. It has a big multi-timeframe squeeze developing, with a monthly squeeze coiled up behind it. Like most of these ideas, AMZN would very likely need a better QQQ to start truly waking up.

MU is a bit of a mess in the short term, but it sits inside a weekly squeeze that could make for an explosive, playable move into the end of 2026. Nothing to do there for now.

AAPL has a great looking daily squeeze. With price under the $350 level and no buy signals on the 15 minute through hourly charts, I want to avoid playing it until the lower timeframes confirm.

My NVDA Calls Have One Bite Left

NVDA is the position I am holding through all of this. The weekly squeeze is solid, and the December $200 calls are a position I would like to hold into the end of the year. I added to them on last week’s flush, scaling in rather than taking the full size at once.

NVDA, Weekly Chart 10.20.26

NVDA weekly squeeze chart for the December $200 calls

The short-term signals on NVDA are not aligned for a move higher yet. When and if that changes, it could be go-time for the weekly setup. If we see a bigger flush first, I will take my final bite of the $200 calls down near the 200 level.

What I Will Trade In The Meantime

Not every idea needs QQQ. GLD and the micro gold futures are developing some short signals, so I will be watching /MGC for potential day trades on the short side.

XLP is off the beaten path for us, purely a rotation play, and it feels extended. If it triggers short on the lower timeframes, a November call credit spread could be a play, betting that XLP fails to take out its big swing highs.

The weekly setups are there. The trigger still matters, so the cash stays put until QQQ confirms.

Stay Focused,

Taylor Horton 

While I wait on my own triggers, Jon McKeever is putting his method to the test with his own money on the line. His new 10-day challenge kicks off with a free live session Wednesday, October 21 at 6 PM CT, where he walks through how supply and demand, PMZ and Tr3ndy Precision work together in real time.

My NVDA December Calls Get Their Dip

The /NQ traded lower into this morning, and the pressure stayed on the Big 10 names, tech and chips especially. SPX spent Wednesday fighting to hold its daily 21 EMA, and QQQ still has to lighten up before any bounce means much. That backdrop cost me two short-term put credit spreads this week. It also handed me the pullback I have been waiting on since August. Let’s take a deeper look at those two spreads, as well as the NVDA December calls.

Two Put Credit Spreads Came Off on Their Rules

DELL came first. I sold the Oct 16 575/570 put credit spread on Friday, October 9, for $1.85, with A+ squeezes forming. On Monday I posted a GTC exit order at $0.90 to take most of the credit off the table if it moved my way.

It did not, and before the open on Wednesday I said DELL needed to hold $550 or it was a cut. It gapped below the daily 21 EMA instead, so I bought the spread back at $4.48. The rule was set before the open, and I followed it.

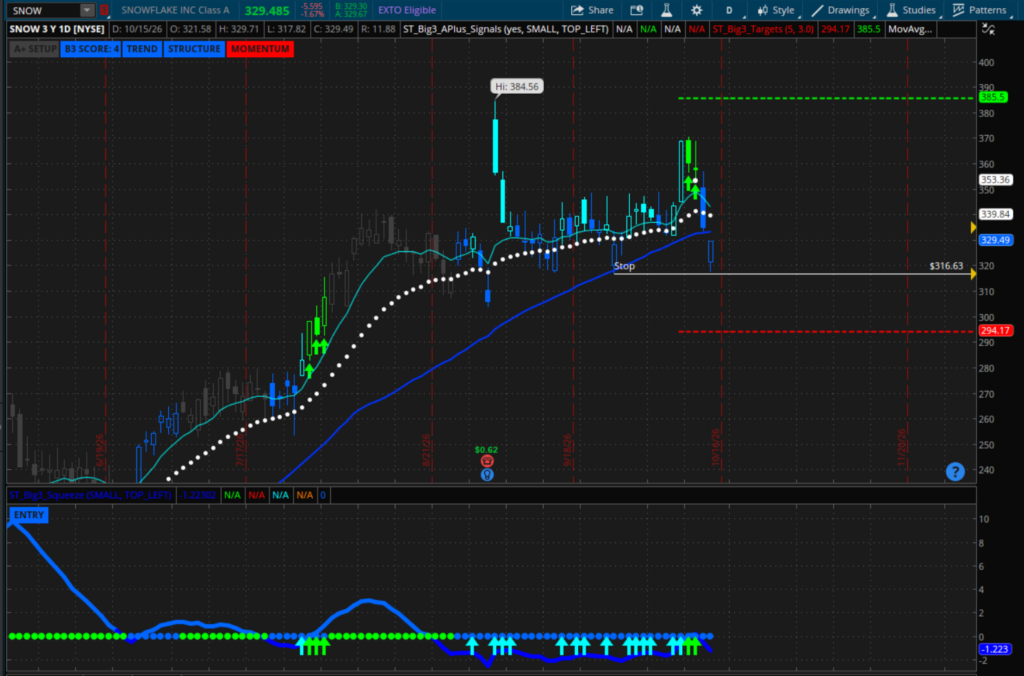
Snowflake came off this morning. I sold the Nov 20 350/340 put credit spread on Tuesday for $3.35, with the daily buy zone around $340 to $350 and the position good to hold anywhere above $330. I bought it back today at $6.97, roughly 54% of the max risk. You can read Tuesday’s full setup in my Snowflake squeeze trade breakdown.

Both trades were sized so a loss like this does not change the plan. That matters, because the same selloff that took them out is the one I wanted for the bigger position.

SNOW, Daily Chart 10.15.26

SNOW put credit spread closed on gap down

The Dip I Wanted in My NVDA December Calls Finally Showed Up

Back on September 10, I wrote about the NVDA flush I was waiting for.  I opened the December calls the first week of August on a Big 3 Squeeze, took only half the size I wanted, and planned to finish the position on a real dip. The dip never came. NVDA gapped into $225 off the August 26 earnings report and kept working without me.

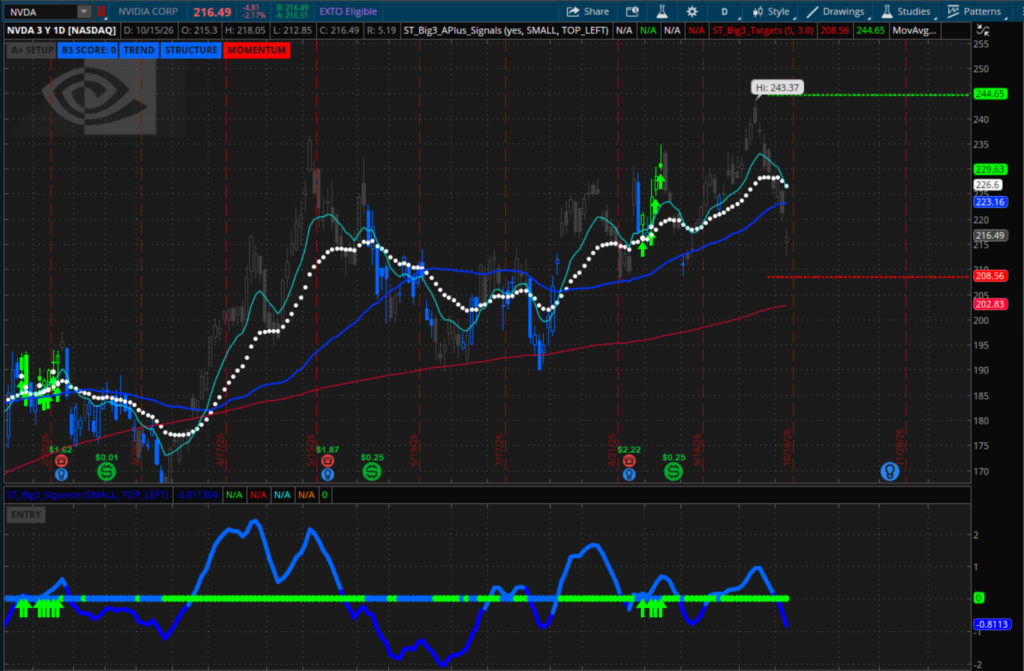
On Tuesday, the squeeze breakout failed after touching a new all-time high near $230. By Wednesday, NVDA had pulled back to the daily 50 SMA. That is the first real test of support since I opened the trade, and it is exactly what I was waiting on.

This morning I added to the December $200 calls. The construction on the NVDA December calls has not changed: long calls, risk limited to what I paid, and plenty of time until expiration.

Why I Am Scaling In Instead of Finishing the Position

I did not take the full add today. The /NQ is still under pressure, and the downside is running across the Big 10 names. I want more of the December calls in both QQQ and NVDA, but the short-term signals say that buying should be done with patience.

The plan is to scale in, and today was one piece. I would take my final add closer to the weekly 50 SMA. If the flush keeps going, the last piece goes on near that level. If NVDA turns up from from here, I already have more of the position on than I did last week.

The two spreads and the calls were never the same kind of trade. The spreads were short-term trades with a hard line under each one, and both lines broke. The December calls are the core position, and the pullback is what I planned to add on.

NVDA, Daily Chart 10.15.26

NVDA December calls add on a flush below the daily 50SMA

Where the NVDA December Calls Stand Now

The upside target has not changed since Tuesday. The third ATR target sits around $255 to $260, above the all-time high near $230 where the breakout failed. For now, I am holding the NVDA December calls and waiting on the short-term signals to turn before the next add.

The rest of the list is on the same footing. QQQ, SMH, AMD, Micron and Google are all waiting on a short-term buy trigger, and nothing gets bought until it fires. I walk through the add, the levels and the rest of the open positions every day in the Compounding Growth Rooms.

Cut the trades that break their rules, and save the size for the setup you have been waiting on.

Stay Focused,

Taylor Horton

Earnings season is when the gaps show up, and Allison Ostrander built a rules-based way to trade them: strict entry criteria, a simple 1:1 risk rule, and trades managed around the close and the next morning’s open. The replay is up now with real trade examples.

Snowflake Finally Gets Its Momentum

We had a really good week over in the alert room last week, and this week has proven to be a bit more challenging so far. The bigger picture is still intact across the big names, the short term is the open question, and I have a couple of brand new trades to cover. Let’s take a deeper look at the Snowflake squeeze trade and the rest of the book:

The full walkthrough is in the video below, with every chart I reference.

Three Closed Trades Paid Last Week

SPCX gave us a pretty good move on a couple of the $150/$145 put credit spreads, so I cashed out of both. I took a chunk of that profit and rolled it into a further out of the money call debit spread for December expiration, what I call a house money trade. If you missed how that one started, here is last week’s SPCX house money trade breakdown.

On the pullback to the 21 EMA, SPCX has to hold that level first. If it does, I’m looking for another short-term buy trigger and possibly a $155/$150 put credit spread, with patience.

ARKK was a few of the December $90 calls, with the goal of catching a move to $95. The high of that candle was $94.82, and we called that close enough for government work. I took profit on the $90 calls and rolled into an out of the money call debit spread for December.

Apple was a day trade off the squeeze. We were in on that candle, caught the pop, took our paycheck and hit the road.

The old Snowflake trade was a buy on the trigger into the close and a profit on the gap up the next morning.

The Snowflake Squeeze Trade Finally Has Momentum

For today’s action, we are back on board with the Snowflake squeeze trade, playing the Big 3 Squeeze with a put credit spread for November expiration. You have the big gap up on the earnings report, a pullback into the buy zone, and the trend fully intact.

The holdup as of late has been momentum. Of the big three, trend, structure and momentum, the first two have been really good. They got a negative MACD shift around mid August, and every pop up until today came with a negative MACD. They kept on trying, and now they finally have momentum and the buy trigger.

Why the Snowflake Squeeze Trade Has One Level to Watch

In a lot of ways this makes for a simple trade. The exit rule on the Snowflake squeeze trade is one level: if they pull back and take out that $332 area, I take off the trade and move on to a different idea. If they hold it, the pattern has room to play out.

Dell Gets a Few More Days Above the 21 EMA

I jumped into Dell yesterday on the squeeze. The plan with that kind of entry is to take it to bed and catch a gap up the following morning, ideally a move into $595 to $600.

Dell has been a little more feisty. It failed the breakout and pulled back to a couple of key levels, including support near $550. As of today’s close, it is back above the 21 EMA. I’m not in a big rush to buy more tomorrow, but with a $575/$570 put credit spread, if they hold above the 21 EMA, I’ll give it a few more days to work.

NVDA and QQQ Failed the Breakout, Not the Pattern

NVDA and QQQ are both based on the squeeze, and for now you have to look at both as failed breakouts. NVDA took out the $230 area and poked its head into a brand new all time high. When the energy in a squeeze finally releases, it can usually give you a move to the third ATR target, about $255 to $260 here. Instead, it pulled back into the range.

Frankly, nothing has really changed. Good structure, a Big 3 score of 14 out of 15, and I would like to buy more. The trigger to add would be a short-term buy signal, and then I’m back in with more of the December $200 calls.

QQQ is in the same boat. Good momentum, good structure, no breakout yet. Things would change on a move back below $700. Until then, I have the December $700 calls, and I’m looking for the same short-term buy trigger to add.

Micron and Google Are Next If the Trigger Prints

Micron needs more time. The squeeze there leans neutral bullish right now, and we don’t buy neutral bullish, we buy perfection. Structure and trend could be better, and the real kicker for the eventual breakout is momentum. No trigger, no trade. If I wake up to a green arrow, I’m looking to buy it with what could be pretty big size.

Google has squeeze on squeeze action, with a squeeze on pretty much every chart I watch. The range has been choppy, which is very normal while a squeeze builds. If the MACD line gets back above zero and it triggers the green arrow, that is the one I would eventually love to buy, and I can work into bigger size there.

QQQ, SMH, AMD, Micron, NVDA, Google: big names, big squeezes. If they wake up with short-term buy triggers, I look to buy.

I want the trigger before I add size, on every one of these names.

Stay Focused,

Taylor Horton

Earnings season turns a lot of trades into a coin flip. My colleague Allison Ostrander is showing how she trades earnings gaps with clear rules and defined risk, live Wednesday, October 14 at 6 PM CT. Save Your Spot.

SPCX House Money Trade: Two Spreads Paid For It

The market is catching its breath this week. The bigger squeezes on my list are still fully intact, but the shorter-term charts on /NQ and /ES have gotten sloppy. I am being extra patient about adding new positions, and hanging tight with what I have. That made it a good week to book profits, and SPCX is where the most interesting ones came from. Let’s take a deeper look at the SPCX house money trade:

Last Week SPCX Was on the Chopping Block

Last Thursday I wrote about how my SPCX put credit spread was on the chopping block. Of all my open positions, it was the one at risk, and the one I was ready to cut. I drew one level, let price make the call, and put in a GTC order to buy the spread back for a profit.

SPCX ended up holding the line, and here is what happened from there.

Two Put Credit Spreads, Both Closed for a Profit

The first spread was the October $150/$145 put credit spread, sold on Friday, September 18 for $2.07. I bought it back on Friday, October 2 for $1.33, which kept about 36% of the credit.

The GTC order I mentioned last week was set at $1.00. I did not wait on it. I took the $1.33 the next morning and rolled the trade instead.

Two minutes later I sold the same $150/$145 strikes for November expiration at $1.95. Same structure, same levels, more time on the trade.

That one did not need the time. SPCX pushed into strength on Monday, October 5, and I adjusted the GTC exit order to take the profit at $1.10. That is about 44% of the credit, held over one weekend.

Neither spread needed a big rally. A put credit spread gets paid as long as the stock stays above the short strike, so the whole job here was SPCX holding above $150. It did that through the week it looked weakest.

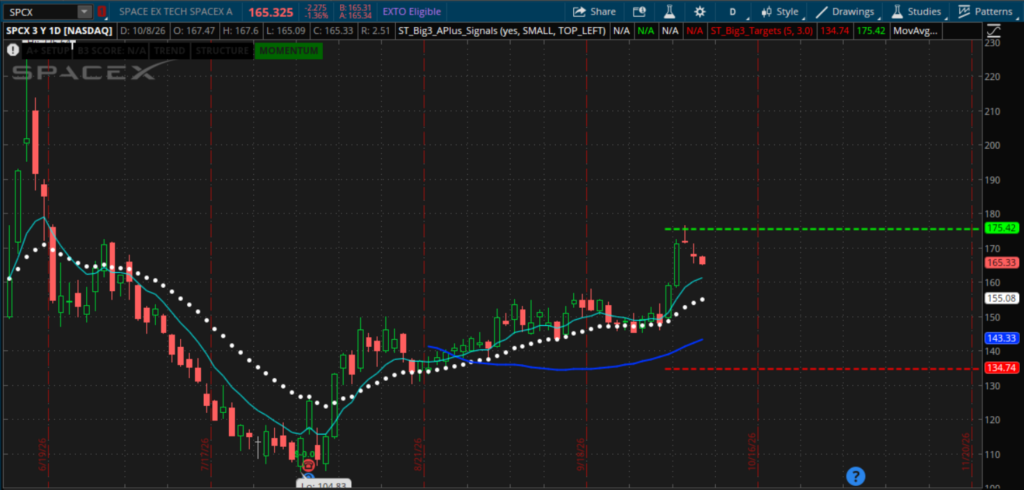
SPCX, Daily Chart 10.08.26

SPCX house money trade daily chart

Why I Opened the SPCX House Money Trade

Six minutes after the November spread closed, I opened a new bullish position on SPCX.

The size is the whole idea. I am risking a percentage of the profits closed on the two put credit spreads, nothing more. In the room I called it opening a shot with house money, and the percentage is up to each trader.

The plan on it is two lines: If SPCX takes out its previous highs for the year, the SPCX house money trade is positioned for a big profit. If it is a bust, the risk was already covered by the two spreads.

The structure and the entry on this one stay in the Compounding Growth Rooms while it is open. Members saw the alert the minute it went in.

The Same Playbook Is Running in ARKK

SPCX is not the only name where I did this. I booked profits on ANET and ARKK this week too.

On ANET, I closed the October $200/$195 put credit spread on Tuesday at $0.73, a quarter away from my original $0.50 target. The stock was strong, so I took the fill instead of waiting on the last piece.

On ARKK, I rolled a portion of the gains into a new position the same way I did on SPCX. Taking part of a win and putting it to work on the next idea keeps me in the names I like without putting fresh money at risk while the market chops.

Where the SPCX House Money Trade Stands Now

Last Friday, QQQ was attempting a breakout into new all-time highs, and I had no plans to fade the pop. This week the markets have come in a bit instead.

As for open positions, nothing to do for now but hang tight. MU, TSM and GOOGL are still on my watchlist, and I want the shorter-term charts on /NQ and /ES to clean up before I add anything new.

On SPCX, the level that matters now is the previous high for the year. The construction on the SPCX house money trade is as so: profits from two closed spreads paid for the risk on the new one, so a miss costs me nothing I started with.

I’m staying patient on new entries until the shorter-term charts confirm.

Stay Focused,

Taylor Horton

Earnings season brings big gaps, and most traders get caught on the first move. Watch the replay of Allison Ostrander’s free session on how she trades earnings volatility.

The NBIS Squeeze I’m Trading Right Now

QQQ hit its extension today, and this is a very tech and chip heavy market. QQQ ranks at 98% on my Scorecard and the S&P 500 at 96%, while RSP sits at 14% and the Dow at 8%. Let’s take a deeper look at the NBIS squeeze trade.

The NBIS Squeeze Trade I Just Opened

Nebius has the Big 3 Squeeze firing on multiple timeframes, with the structure and trend already in place. The only holdup was momentum, and the MACD line finally shifted. I am wrong on the NBIS squeeze trade under $220, and the first target is $265 to $270.

I am still holding my QQQ December $700 call and my NVDA December $200 call. I also took profit in SPCX, ANET and ARKK, and rolled a chunk of those profits into call debit spreads for year end.

Things do not have to go up in a straight line. Until the rankings change, a pullback that holds the 21 EMA could be a buying opportunity. The full NBIS squeeze trade breakdown, plus the Micron setup I am watching, is in the video below.

Stay Focused,

Taylor Horton

Earnings gaps move fast, and most traders get caught on the first move. Join Allison Ostrander tomorrow night as she breaks down her Gap n Go Formula for trading the gap. Save your spot here. 

My SPCX Put Credit Spread Was On The Chopping Block

The tape looked solid this morning. MU reported last night and was flat in the pre-market, and with that report behind us, QQQ, NVDA and MSFT all look breakout ready. That makes this a good week to show how I manage a position that did not cooperate right away. Let’s take a deeper look at the SPCX put credit spread:

Why SPCX Made My List

On Friday, September 18, SPCX showed up on my watchlist off the Top Bull rankings from the prior day’s close, right alongside AAPL, DELL, META, CRWD, MU, AMD, ANET and NVDA. That afternoon I sold a put credit spread on it in the Compounding Growth Rooms.

A put credit spread is a defined-risk way to lean bullish. I collect the premium up front, my max loss is set the moment I open it, and I do not need the stock to rip. I need it to hold above my short strike into expiration. That is the type of trade I like to pair with a name ranking well in my Big 3 Squeeze system.

By Wednesday, September 23, it sat in the open positions list next to ARKK, NVDA, QQQ and AVGO. I held it into the weekend on Friday, September 25.

The SPCX Put Credit Spread Hit the Chopping Block

Monday, September 28 is where it got uncomfortable. That same day Starship reached orbit for the first time, and by the afternoon SPCX was still the weakest of my open positions. I told the room it was the one at risk of being on the chopping block if it could not improve that week.

Tuesday morning I was blunt about it: not a huge fan of this one at the moment. If it could work its way back above the 21 EMA, I would let the trade work. Otherwise, it was the only open position I was ready to cut.

A position on the chopping block does not mean I panic. It means I define the line ahead of time, and I let price tell me which side of it we are on.

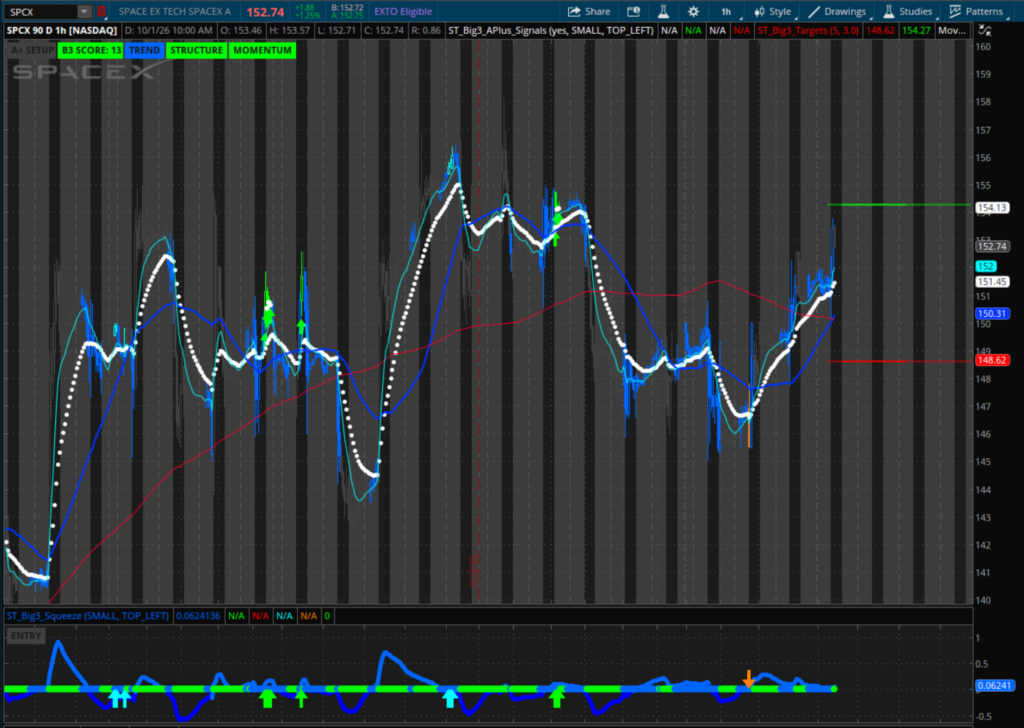
SPCX, Daily Chart 10.01.26

SPCX put credit spread daily chart with the 21 EMA

The Line I Drew

Early in Tuesday’s session, I set the hourly 200 SMA as the over/under level for the trade. I did not want to get shaken out on a minor dip below it, but a hard break of that level would trigger a cut of the position, and I said I would post the exit if it failed.

It did not fail. By late morning SPCX had a nice recovery off the opening lows, and I held. In Tuesday’s video I said this was the put credit spread I wanted to add to.

Wednesday, with MU earnings on deck that evening, I cut the rule down to one sentence: this is a hold so long as it does not take out the low of the week. It held that too.

The exit rule on the SPCX put credit spread never changed once it was set. I only made it shorter.

SPCX, Hourly Chart 10.01.26

SPCX put credit spread hourly chart with the 200 SMA

Where the SPCX Put Credit Spread Stands Now

This morning I put in a GTC exit order on the SPCX put credit spread to buy it back for a profit. In four sessions it went from the one name on the chopping block to the one I am working an exit on. That order is working as I write this, and when it fills, members will see it in the room first.

The exact entry and the exit order stay in the room. What I can show here is the process, because that part does not change from trade to trade. If the order fills, the trade is done. If SPCX takes out the low of the week first, the cut happens instead, and I will post that too.

Headlines Did Not Make the Decisions

It has been a loud stretch for SpaceX. Starship’s first orbit put 26 Starlink satellites up, and the Crew-13 mission to the International Space Station was lined up for this week. None of that showed up in how I managed this trade. Every decision came off a level: the 21 EMA, the 200 SMA, and the low of the week.

Same rule as always: pick the level before the trade gets tested, then let price make the call.

Stay Focused,

Taylor Horton

Chasing a setup late can flip your risk and reward upside down. Watch the replay of Tr3ndy Jon McKeever and Melissa Beegle’s free Trendy Precision session and see the check Jon runs before every entry.